
Key Takeaways
-
The use of analytics across multiple industries has inspired higher education institutions like Valdosta State University to explore innovative uses of insights from data for both academic and operational functions.
-
While many might perceive visually appealing dashboards as representing analytics in higher education, VSU's IT team understood the importance of focusing on how data influences actions and reactions.
-
The IT team sought key characteristics such as flexibility, transparency, and the ability to integrate with other systems.
Tailored alerts and messages reach us through mediums including television, smart devices, websites, e-mails, and social media. Daily insights from data communicate various outcomes and drive the way we make decisions. Many companies use data gathered from our web activity, browsing patterns, and purchases to predict our interests. Automobile pre-collision systems use analytics to improve our safety. The successful use of analytics across multiple industries has inspired institutions of higher education like Valdosta State University (VSU) to explore innovative ways to use such insights for both academic and operational functions.
The Early Days of Analytics at Valdosta State University
VSU is a comprehensive university within the University System of Georgia. The institution currently serves more than 11,000 undergraduate and graduate students representing 157 Georgia counties, all 50 states, Puerto Rico, the Virgin Islands, American Samoa, and Washington, D.C. and hosts more than 300 international students from 76 countries.
Prior to 2011, VSU had no real enterprise reporting solution for providing dashboards, trends, or predictive analytics. Working with the university's various information systems, which include Desire2Learn, PeopleSoft, Blackboard, ADP, and Banner, the Division of Information Technology team leveraged Oracle business intelligence tools to construct a framework that not only integrated these solutions but also improved the ability to gain rapid — in most cases, real-time — insights from our data.
Building a successful data-driven culture at an organization generally starts with a small use case that is low in cost and can produce outcomes in a fairly small window of time. With this in mind we launched a pilot project in 2012 using analytics and predictive models to promote early intervention for students. Instead of building a full suite of reports and dashboards, the Divisions of Enrollment Management and Information Technology started with a basic process that used information to provide alerts to advisors and student support staff. The project aimed to assess whether early alert triggers and historical trends could help prevent student attrition and ultimately improve student success. While many might perceive visually appealing dashboards as representing analytics in higher education, VSU's IT team understood the importance of focusing on how data influences actions and reactions. Choosing a technology platform that can support any data-driven initiative is important for future growth and expansion.
Reports and dashboards, although important, are used primarily to provide information on past transactions. Transforming data into actionable intelligence drives business processes that influence change and help achieve strategic goals.
Information Delivery Redefined
As the first step in building an actionable intelligence environment, identify the institution's top priorities and strategic goals. At VSU we focused on improving student success as our top priority. At its core, a student success initiative must help you understand your students, their risk factors, and the insights advisors need to provide personalized coaching. Student success analytics encompass various metrics and information resources. Common metrics such as student grade point average, demographics, test scores, program of study, and academic standing should go into traditional reports for advisors. Actionable intelligence presents this information in multiple formats and integrates with the applications advisors use regularly.
The metrics themselves should guide navigation and decision making where appropriate. Information and insights should be easily accessible, requiring little training — similar to sitting in the driver's seat of a vehicle where everything required to navigate is displayed and within arm's length. A dashboard for an advisor should take a similar approach. All the important metrics should be clearly visible in one spot. The VSU Success Portal, shown in figure 1, provides a simple dashboard to give advisors quick facts about their advisees and actions that need to happen.
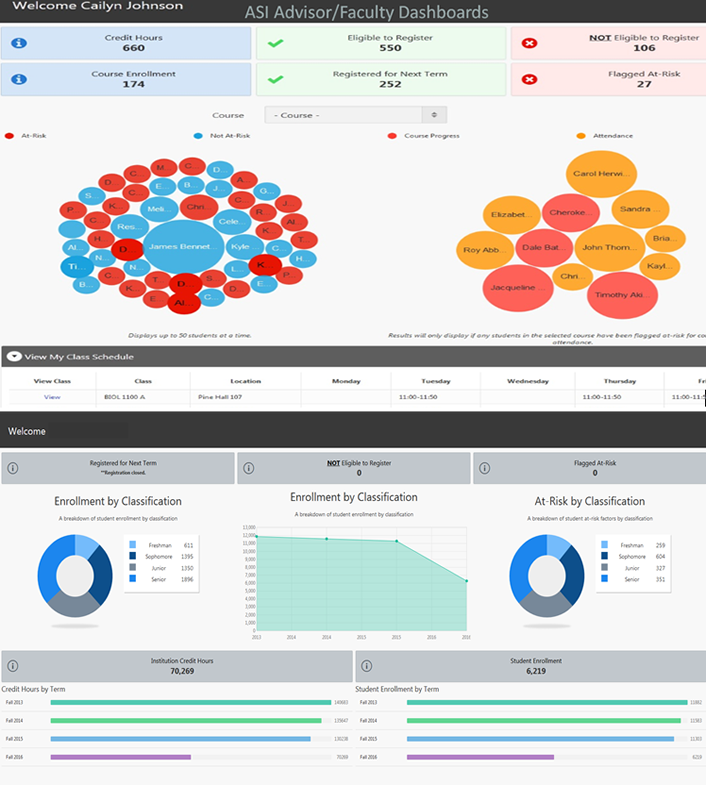
Figure 1. VSU Success Portal
"The portal has become a part of our office culture," said Alicia Roberson, director of Centralized Advising. "As retention interventionists, we rely heavily upon the early alert triggers provided within the portal to assist us in how we communicate with our advisees. The faculty are our eyes and ears, so we regularly monitor the notes they place in the portal to ensure students are performing well and we stay on top of any risk indicators."
With a culture of academic and predictive analytics established, institutional leaders began to explore ways of streamlining information delivery through the use of the student success application and other technologies. Like the success portal, the university's MyVSU student portal is available from your desktop or the V-State mobile app. Responsive design provides fewer ads on mobile, but analytics are still used. Both the portal and mobile app use data analytics, customizable dashboards, and visualizations to give users personalized experiences based on their roles and needs within the university. Users also gain immediate access to regularly used and critical services like e-mail, online courses, events, news, financial aid, and registration pages. Push notifications and up-to-date feeds provide students, faculty, staff, administration, and alumni with the latest university news and activities.
"The generation of students we now have in the classroom see frequent contact and communication as a really good thing," said Kathleen Lowney, professor of Sociology. "Use of technology allows us not only to intervene while there is still time to do so, but show our students that we care about them and their performance. I have been a strong supporter since [the VSU Success Portal] was introduced at the university."
Delivering analytics and personalized information through the MyVSU student portal aimed to expand the delivery of analytics through various technology platforms both on-premises and in the cloud. It also required a deep understanding of business processes related to student accounts, registration, and aid. Documenting key dates for items such as financial aid are important when building communication plans. To accomplish this we implemented a cloud integration platform to enable us to quickly incorporate various third-party resources and marketing tools. The integration platform also allowed us to enhance business functions such as our admissions customer relationship management (CRM) and communications tool. Pushing analytics into our cloud communication tools allowed near real-time integration and workflow automation.
While analytics are not the core of the cloud applications, they play a key role in triggering workflows and automations to deliver timely and personalized communications to students. Communication tools provide analytics on the success of various campaigns such as e-mail. Our IT team expanded the base user definition to include analytics from our data warehouse. Integration platforms simplify and provide out-of-box functionality to connect many resources used at an institution. They also make transitioning to cloud applications easier. The images in figure 2 highlight VSU's integration of our on-premises student information system (SIS) with our cloud marketing solution using cloud services.
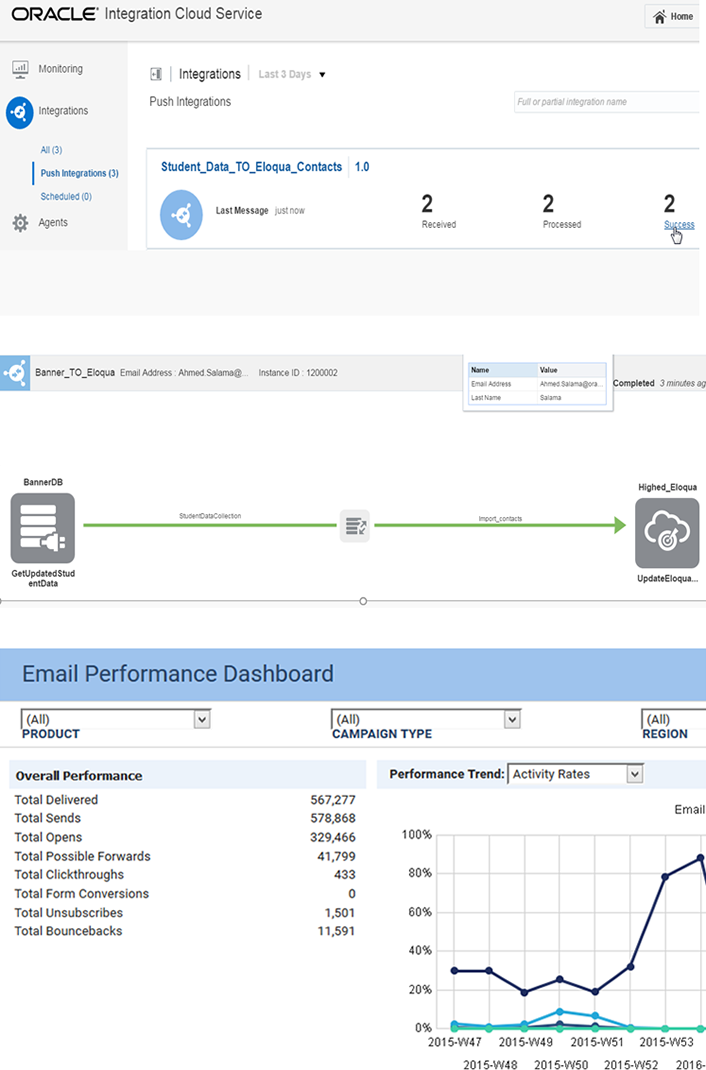
Figure 2. Integration of VSU's SIS with cloud-based marketing services
With the MyVSU student portal integrated with the VSU Success Portal and V-State mobile app, a communication strategy was devised to determine how each medium would work in tandem to deliver real-time information to students, faculty, staff, and administration across the university based on their needs. For example, if the student success application flags a student for course progress in a particular subject area, that student will likely receive tailored ads or messages about tutoring sessions in the MyVSU student portal. Likewise, every time students use their identification cards at events, dining halls, or recreation venues on campus, business intelligence tools trace this information. Personalized messages and ads can be delivered to that student through the student portal and mobile app based on his or her particular academic needs, interests, or routine. See figure 3.
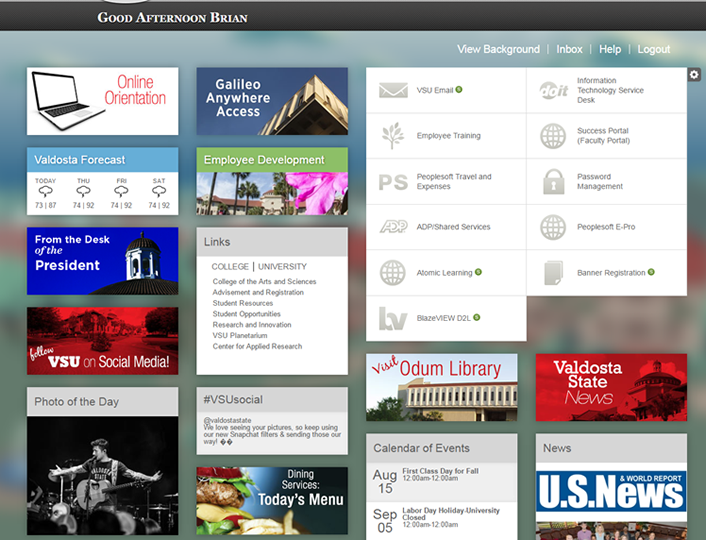
Figure 3. MyVSU personalized student portal
Predictive Analytics and Competency-Based Education
Optimization of academic and administrative functions has also been a priority in the university's shift to a data-driven culture. In addition to the traditional reporting we incorporated predictive analytics to help identify student risk metrics before the start of the semester. When choosing the right technology we looked for solutions that were flexible, transparent, and allowed integration with other resources. We considered transparency important because we need the ability to update and build new predictive models. Like most institutions, we leverage various technologies both on-premises and in the cloud. Integration with other systems was critical because we believe analytics should be incorporated with all student information resources. Predictive modeling requires a data warehouse and the assistance of institutional research staff. Some tools available automate models and integrate results with high accuracy ratings. Solutions such as Oracle's Advanced Analytics allowed us to build models over a few months and integrate them in our VSU Success Portal, MyVSU student portal, and data warehouse. The solution automates many complicated steps, reducing the implementation time and increasing the value of the investment. Figure 4 shows an example of a model that pulls information from the database, runs it through various algorithms, and stores the results so they can be easily integrated.
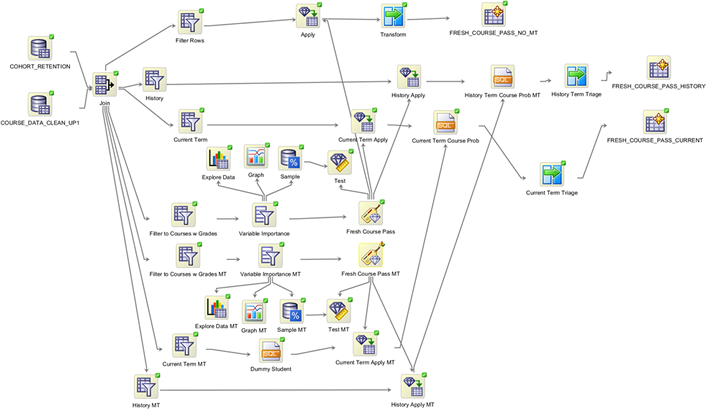
Figure 4. Predictive analytics model simplifying many complex processing steps
Competency-based education is a new initiative at VSU. To leverage our learning management platform, we needed a way to analyze a student's progress and activity in the LMS. We needed analytics and alerts to provide strategic communications to support staff if a student got off track. We are creating custom dashboards for students to show their progress through all competencies and endorsements (figure 5).
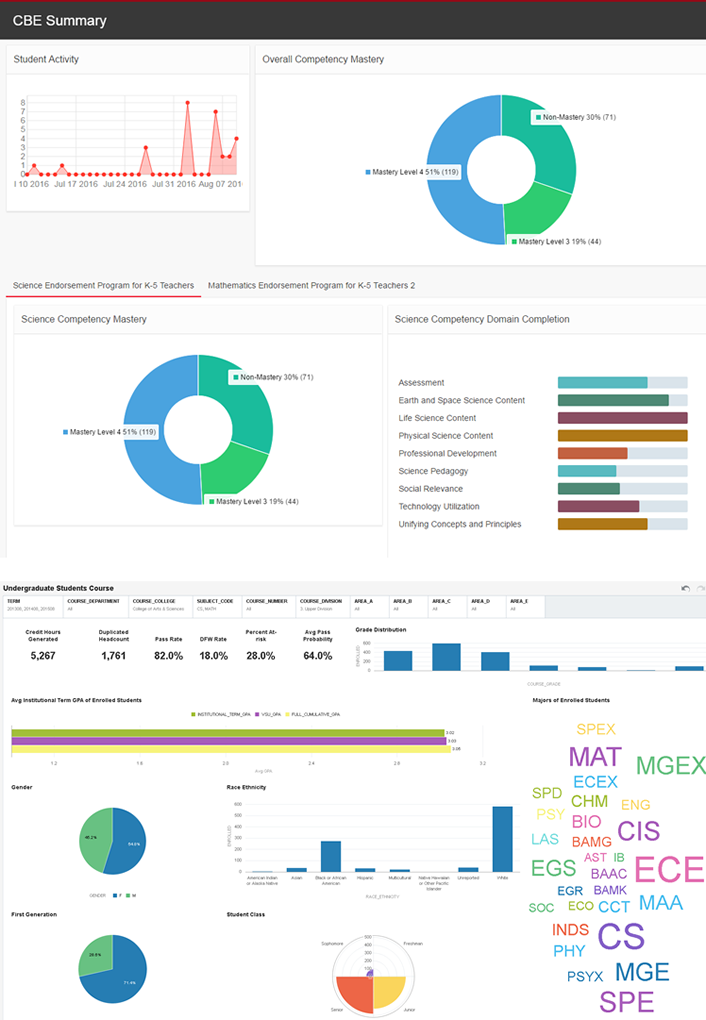
Figure 5. Sample dashboard of student competencies
Centralizing Communication
VSU's most recent project includes the use of new designs in automation, analytics, and telecommunications to address the need for a more streamlined way to answer questions usually fielded by three different offices: The Welcome Center, Admissions, and the IT Help Desk. The new VSU Solutions Center, a partnership between VSU's IT and Enrollment Management teams, is staffed with existing employees and students who serve as the first points of contact for calls to the three offices. Callers can now speak with one representative who can answer many common questions, and callers only get transferred for issues requiring specialized expertise. Solutions Center staff achieve this using BI dashboards and analytics delivering insights across various information systems. Already, hold times in the supported areas have been reduced by almost 50 percent.
"To be a part of an office that directly influences the satisfaction of students and future students is very rewarding," said Marsallis Ponder, a senior student who works in the VSU Solutions Center. "Everyone within the center is well-versed on how to handle the calls, and everyone is genuinely eager to work with students to make sure their needs are met. As a student myself, it is a great feeling to represent the university at this level and provide the best experience for others."
In the coming year, the center will cover additional offices to increase the scope of support. This new strategy giving responsibility to Solutions Center staff also reduces the load on professional staff in the supported departments, allowing them to focus more on specialized tasks and duties. Ongoing improvements will result from creating and adopting best practices commonly seen in hospitality industries and concierge services.
The Solutions Center example makes evident the importance of choosing a BI platform that can support various business goals. We leveraged our existing resources to build a dashboard model for the Solutions Center. As shown in figures 6, 7, and 8, the dashboards analyze call patterns, tickets, and caller demographics. This information helps us plan resource needs and provides opportunities to improve communications. The agents in the call center have quick access, similar to a vehicle dashboard, to all the necessary information related to the student account. This allows for faster service and a consistent experience to callers. We leveraged Cisco, Infortel, and Oracle solutions to create the Solutions Center's capabilities to provide a fast, consistent experience to our students and community.
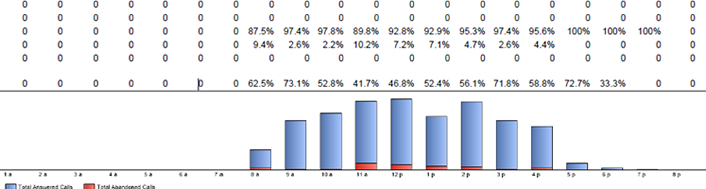
Figure 6. Dashboard for call patterns
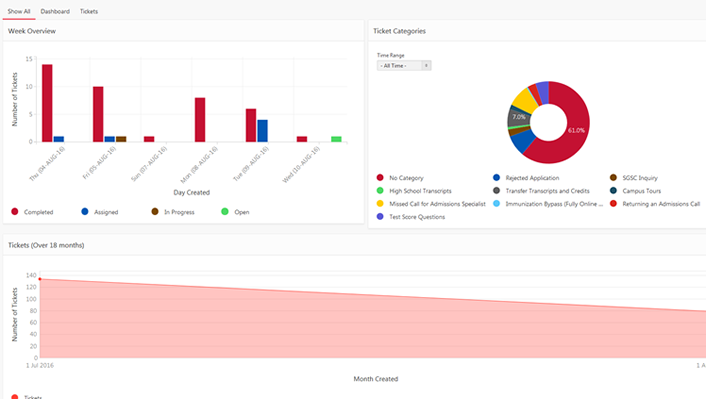
Figure 7. Dashboard for ticket tracking
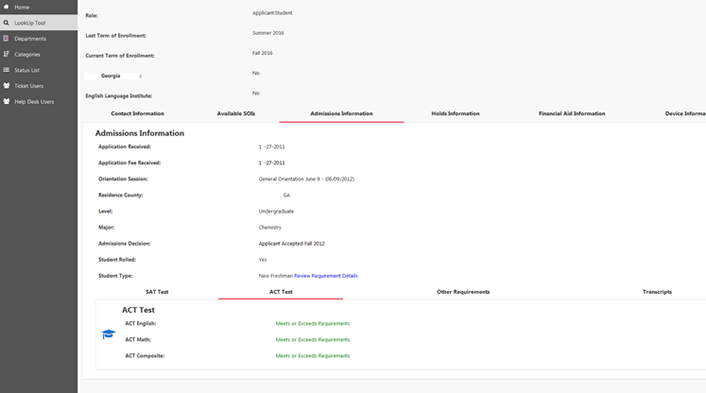
Figure 8. Dashboard for caller demographics
The Future of Analytics at Valdosta State
The IT department continues to work with various colleges and divisions across VSU to provide solutions that place useful data at their fingertips, help increase efficiency, and improve outcomes. The team is currently developing a solution for the university police department by applying BI analytics and insights to provide officers with interactive dashboards in their police vehicles for use while patrolling.
These dashboards will show a summary of class schedules, including examples of the number of students who might be on campus each day. The officers will also be able to pull up student information. They already have access to a limited set of student data from their office desks and typically call the dispatch office if they need that information while patrolling — which is time-consuming and inefficient. The dashboard will help simplify access to the data and present the information in a more easily understood format.
VSU's IT team leans heavily on executive leadership, whose support drives the adoption and use of these innovative analytics-based solutions. Faculty and advisors also have leading roles in improving this environment by enabling more personalized content and support strategies for students. Constant communication with faculty and staff helps foster the adoption of our new analytics tools and cultural changes needed to further enhance the university's data-driven environment.
Brian Haugabrook is chief information officer at Valdosta State University.
© 2016 Brian Haugabrook. The text of this article is licensed under Creative Commons BY 4.0.