Learn how the EDUCAUSE Benchmarking Service takes the use of analytics to the next level by helping CIOs and other campus leaders measure progress on campus-wide strategic initiatives.

How can a college or university apply the tools in the EDUCAUSE Core Data Service and EDUCAUSE Benchmarking Service to achieve its goals? One example steps through a college CIO's process in using analytics to evaluate their context and support a new initiative to improve their standing among peer institutions.
Scenario
Common College is a medium-sized, private, residential college in the heart of a picturesque community. Common provides an excellent educational environment, but economic changes have caused enrollment numbers to drop rapidly. What's more, Simon College, a similar school within the same geographic region and Common's primary competition, has managed to minimize tuition increases. Enrollment at Simon College has remained stable, and Common's trustees have become increasingly concerned about its financial health.
Preston Dent, PhD, a career college president well known for turnarounds, was just named the new president of Common College. Dent's first order of business is to get Common back on its financial feet. Given the competition from Simon, Dent believes that Common must differentiate itself. After reading EDUCAUSE's Top 10 IT Issues and Key Issues in Teaching and Learning, he wants to explore e-learning as a way to enter new markets outside the traditional recruiting territory. Over the past five years, Common's faculty have experimented with e-learning delivery, but the college would need to seriously commit to the initiative to affect the enrollment trend.
Joe Seio is the chief information officer at Common College. The college community appreciates the IT organization, which has a reputation for excellent customer service, reliability, and stability. President Dent expects IT to be fully capable of supporting the e-learning initiative and during their first meeting asks his CIO to explore what it would take to expand the e-learning program at Common.
After the meeting, Seio retreats to his office somewhat nervously because he knows his organization is somewhat resistant to change and already feels strained under its current workload. Seio calls another CIO who he knows helped launch an e-learning initiative at her school five years ago. She tells him that she couldn't have done it without first fully assessing the current state of her organization and benchmarking it with similar schools that had e-learning programs. "Benchmarking," Seio says to himself. Good thing he remembered to complete the EDUCAUSE Core Data Service (CDS) survey this year. He's going to need that information.
Step 1: Finding Peers
Free and open to all institutions, the EDUCAUSE Core Data Service has helped IT leaders assess their operational capacity since 2002. The annual survey gathers IT financials, staffing, and services data. Survey participants receive access to CDS Reporting, a self-service tool that enables institutions to create custom peer groups, view data in graphics and tables, download detailed reports, and look up responses to individual questions.
Seio knew the information he needed to understand Common's capacity and capability to support e-learning could be found in CDS data. The first thing he needed to do was find his aspirational peers, a set of institutions like his that already had mature e-learning programs. By studying the capacity and capability of these institutions, he felt that he could get a sense for where Common's gaps lay.
Common College has around 7,300 students and spends about $225 million dollars each year. Using the peer grouping interface in CDS Reporting, Seio selected all U.S. master's institutions with fewer than 10,000 student FTE and less than $300 million in institutional expenditures, identifying 57 institutions. He further refined this set by identifying 11 institutions that had high ratings on most of the items in the e-learning maturity index — Common's aspirational peers (figure 1).
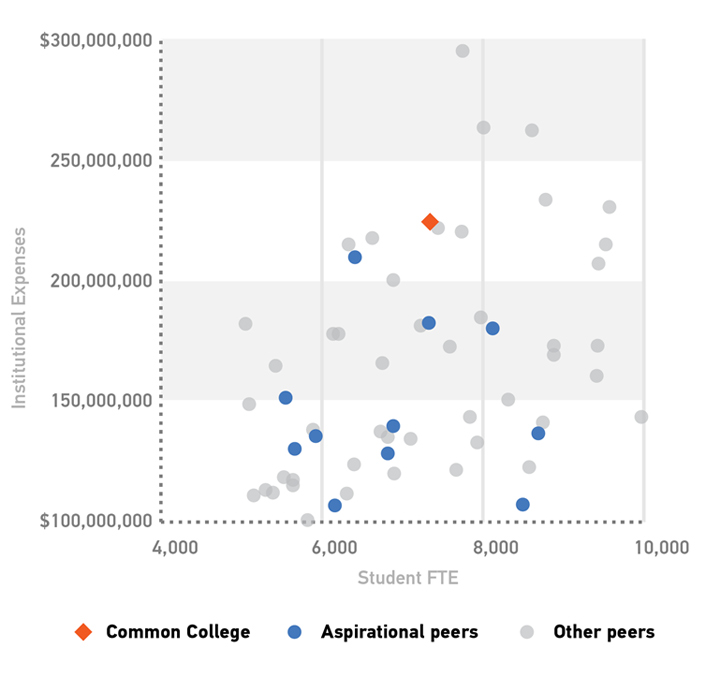
Figure 1. Peer institutions for Common College
On reviewing the financial standing and student population of the selected peers, Seio found that Common is comparable in size, but has higher institutional spending and might have more resources at its disposal than the institutions with mature e-learning programs. Given the right adjustments in strategic priorities, Seio expects that an e-learning initiative will be feasible for Common College. Now, can IT hold up their end?
Step 2: Organizational Assessment
To determine IT's capacity to deliver the support and infrastructure needed for an e-learning initiative, Seio turned to the CDS Core Metrics. Given the variety of institutional missions, strategies, and priorities, no single metric gives a comprehensive benchmark of IT's capacity and value to an institution. The CDS Core Metrics, derived from multiple IPEDS and/or CDS questions, provides valuable indicators of IT operational efficiency.
The CDS Core Metric on central IT spending as a percentage of institutional expenses can be used to evaluate the role IT plays in terms of institutional spending patterns. Alternatively, total central IT spending per institutional FTE (students and employees) can be used to estimate the amount of IT support individuals at an institution receive. When compared to aspirational peers, both metrics can help an institution determine its relative ability to achieve a desired state given its current capacity. The results in figure 2 demonstrate that IT funding at Common College is on par, if not better, than many of its aspirational peers.
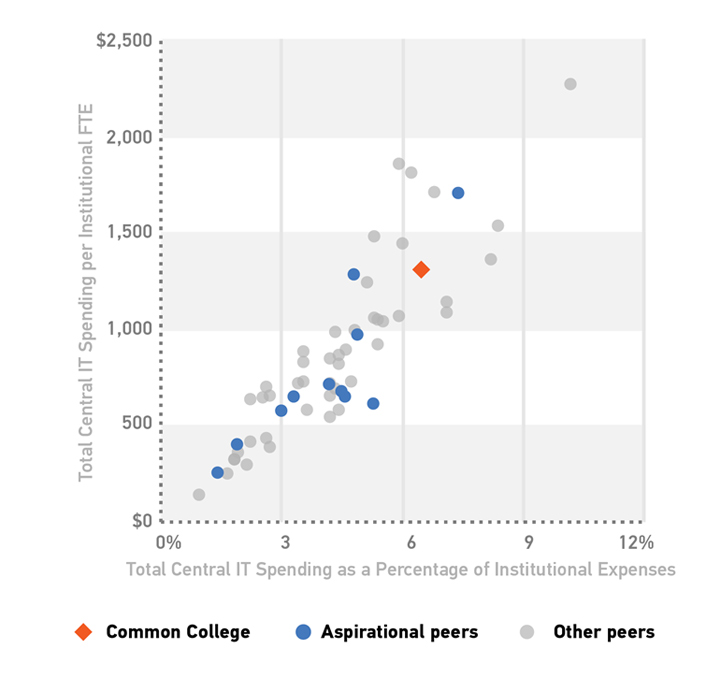
Figure 2. Total central IT spending as a percentage of institutional expenses vs. total central IT spending per institutional FTE
Another CDS Core Metric, central IT FTEs per 1,000 institutional FTEs, provides a view into the level of IT support an institution's people receive. This metric can be used to quickly estimate a benchmark for total central IT staff FTE. For example, in FY2014/15, U.S. institutions had a median of 7.8 central IT staff FTEs per 1,000 institutional FTE. Thus, an institution with 10,000 institutional FTEs would have had roughly 78 central IT staff members. Figure 3 reveals that in addition to funding, Common's IT staff size is comparable to aspirant institutions.
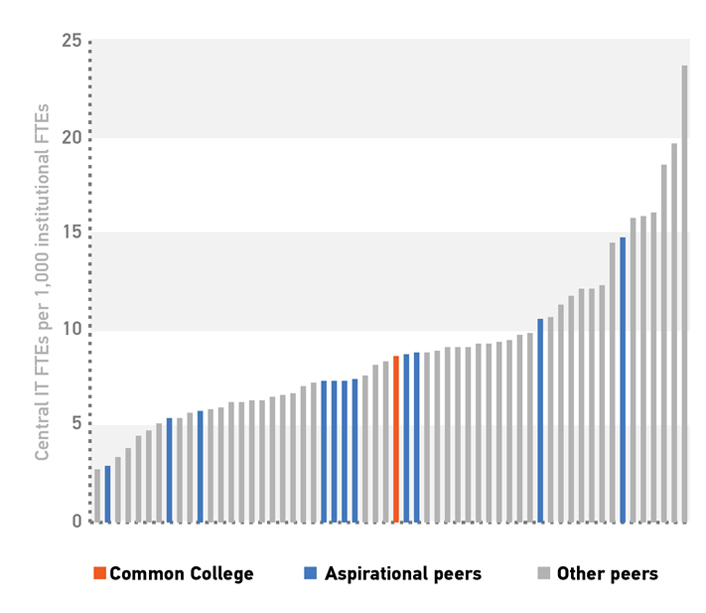
Figure 3. Central IT FTEs per 1,000 institutional FTEs
In addition to overall spending and staffing numbers, Seio thinks about IT's service portfolio, the balance of spending across IT domain areas, his staff's current workload, and the projects currently underway. His team is committed to high-quality user support and teaching and learning services; e-learning would make a good addition to the portfolio. Thanks to the IT strategic plan his team put in place a few years ago, IT has been diligently working to gain efficiencies by focusing on their core competencies and relying on alternative sourcing strategies for everything else. They contract with an outside vendor to provide telephony, use collocated data center services hosted by another nearby institution, and this year will complete their e-mail migration to Google. He thinks that if they continue down this path, they can make room for e-learning.
Step 3: Capability Assessment
After benchmarking IT's organizational capacity, Seio feels more confident that IT can shoulder the expansion of e-learning at Common College. Even though he has the funding and staffing levels he will need to help with this initiative, he knows that IT's current workload will have to shift substantially to accommodate this new priority. How will it shift? What will it take? How can he prepare his staff for a change in expectations?
Again, he picks up the phone to call his peer CIO with the mature e-learning program. He shares his progress on benchmarking operational efficiency against aspirant peers, but explains that he feels stuck on how to plan for the expanding e-learning program. She mentions that EDUCAUSE now offers an enhanced benchmarking service that enables institutions to benchmark their capability to deliver on strategic initiatives. This new service is built on the CDS database and leverages data submitted through the CDS survey to produce semi-customized benchmarking reports that can be used to 1) assess organizational capability for initiatives and 2) communicate the value and relevance of information technology. "I think there's one on e-learning," she says. Seio thanks her again and goes searching for the EDUCAUSE Benchmarking Service.
The EDUCAUSE Benchmarking Service
In January 2016, EDUCAUSE launched the EDUCAUSE Benchmarking Service BETA. This service brings EDUCAUSE analytics to the next level by helping CIOs and other campus leaders measure progress on campus-wide strategic initiatives. The service provides capability reports comprised of maturity and deployment indexes for a suite of strategic initiatives. The reports support an institution's efforts to:
-
Measure the capability to deliver IT services and applications in a given area
-
Examine multiple dimensions of progress — technical and nontechnical — such as culture, process, expertise, investment, and governance
-
Enable institutional leaders to determine where they are in delivering a service and where they aspire to be
-
Measure the degree to which an institution has deployed the technologies related to delivering a service, based on a standard scale reflecting stages of deployment
-
Measure maturity in innovation broadly, reflecting on key elements to help develop and maintain a culture of innovation that supports the use of new technology in support of institutional and student success
Editors' Note:
Since the publication of this article in June 2016, EDUCAUSE has integrated the EDUCAUSE Benchmarking Service into the Core Data Service. During beta testing, members shared that they prefer to have all their data in one place. The maturity and deployment indices constantly evolve in response to members' needs. Topics include analytics, disaster recovery, educational technology services, information security, and student success technologies. Annual Digital Capabilities in Higher Education reports also provide a view into the current status of digital capabilities within higher education.
When Seio finds the EDUCAUSE Benchmarking Service, he sees that his assessment of Common's e-learning capability from his CDS survey submission is already waiting for him. He is also surprised to see that the peer groups he created for his organizational assessment are accessible through this service. With a few clicks he creates an e-learning capability report for Common College. The results are less than ideal (figure 4).
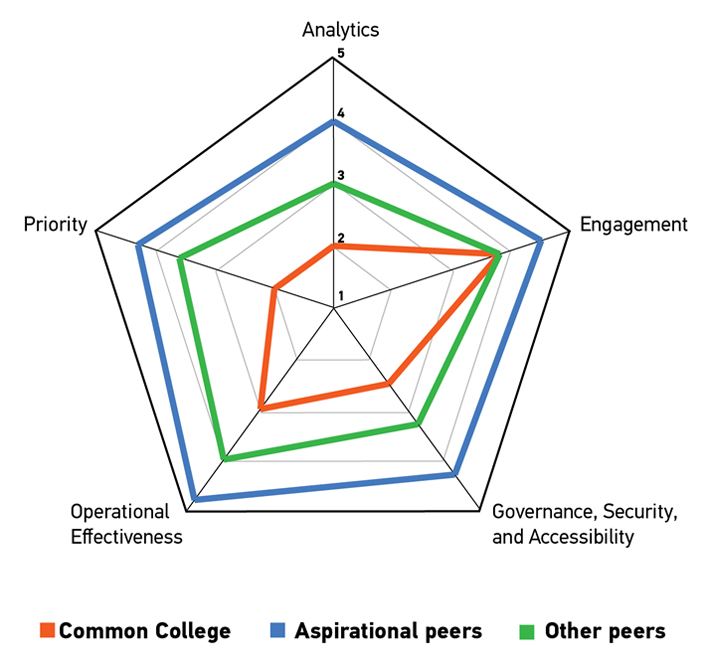
Figure 4. E-learning maturity dimension scores
The e-learning maturity index is a general assessment of progress in e-learning, defined as learning that involves a web-based component, enabling collaboration and access to content that extends beyond the classroom. The assessment measures progress along five dimensions.
- Analytics: Demonstrates learning and strategic outcomes from e-learning technologies through planned and valid use of analytics
- Engagement: Builds a collaborative environment where evaluation of, and training for, new e-learning technologies are available to administrators, faculty, and staff
- Governance, Security, and Accessibility: Demonstrates that e-learning is an integral part of the institution through establishment of policies and procedures related to disability services, student identity security, and intellectual property
- Operational Effectiveness: Creates an e-learning division with a cohesive and centralized functional structure that allows for planning, management, and evaluation of all institutional e-learning technologies
- Priority: Develops e-learning as an institutional priority through resource allocation, strategic growth, and personnel appointments
Common College clearly lags in e-learning maturity. Where should they focus? Due to their commitment to training and faculty collaboration on the few e-learning services they do have, Common is most mature in the area of e-learning engagement, but least mature in the areas of priority and analytics. With President Dent's commitment to expanding the e-learning program, his CIO feels that the priority dimension is about to improve substantially. After reviewing the results for both peer groups, he realizes that analytics is the least mature area for his peers as well. This leaves operational effectiveness and governance, security, and accessibility as potential opportunities for improvement.
In addition to the dimension benchmarks, Seio notices that the report also provides him with benchmarks for each item in the maturity index, along with recommendations for improving in challenging areas. He flips to the section on governance to identify a few key focus areas. He notes that Common lacks formal governance and policies for e-learning. Moving on to operational effectiveness, the results confirm that although the e-learning systems currently in place at Common are reliable and considered to be mission critical for some courses, they are not scalable or adaptable.
Seio wonders which e-learning systems to prioritize for scalability and adaptability. At the end of the report, he finds benchmarks for e-learning technology deployment. He recognizes some of the technologies listed from Common's participation in the EDUCAUSE Center for Analysis and Research's (ECAR) student and faculty studies. These studies evaluate technology expectations and experiences for institutional users and could potentially provide Common's CIO with the direction he needs.
Innovation, a Key Ingredient
The Culture of Innovation Index within the EDUCAUSE Benchmarking Service suite complements any of the indices. Any institution looking to improve its maturity and deployment capability, regardless of the content area, will be engaging in innovation — the process of meeting needs and solving problems. Those efforts require skills and awareness in the same way that the other indices do.
In figure 5, Common College has likely had some success with innovation, which places two of their metrics (learning agenda and leadership) far ahead of the average for U.S. institutions granting BA and AA degrees, but it may be resting on its laurels: the institution is not setting the pace on policy environments or capacity, both of which are key to continuous innovation. It's also clear that the money, time, and talent commitments are lower than average. All of this suggests that Common College might, like many institutions, be treating innovation as an event — something you do once and then not again until someone or something requires it — rather than a process that can be repeated as needed.
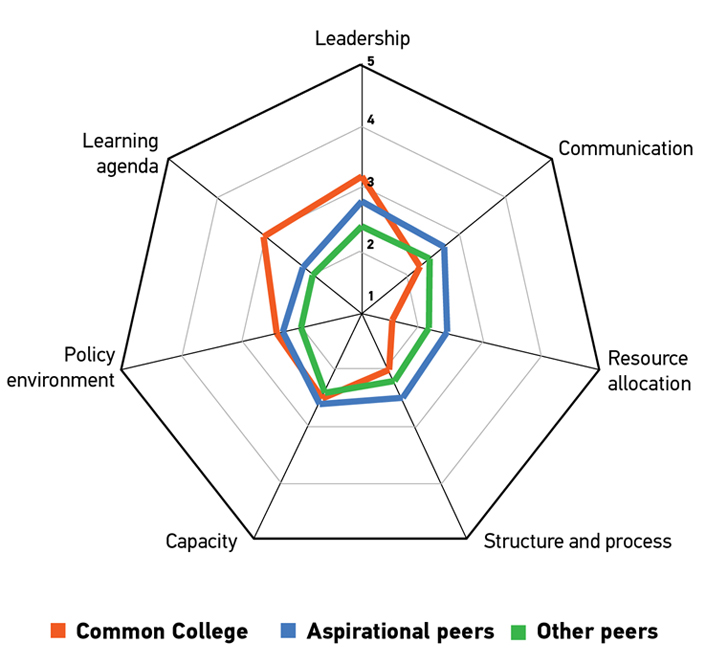
Figure 5. Culture of innovation maturity dimension scores
To combat this dynamic, the institution should renew its commitment to innovation by dedicating all three resources to new efforts, perhaps aligning its strong learning agenda to specific projects to improve policy and capacity. This will enhance the interest in renewing a commitment of resources (leveraging strengths to improve weaknesses). For employees whose job centers on innovation, ensure they receive stimulating professional development to build capacity. Review policies frequently to ensure they support and align to the innovation agenda rather than inadvertently hampering it. (Read more about resource commitment to innovation here and here.)
Embedding innovation into your organization protects it from changes in leadership and enables it to adapt to new agendas as priorities shift. "Build an Innovation Engine in 90 Days" provides useful ideas for making innovation part of the organization, not just a "good idea."
Step 4: User Assessment
Students and faculty are arguably the most important consumers of higher education IT services. The longitudinal research provided via the ECAR student and faculty studies can benchmark campus consumer perceptions and catalyze conversations among IT professionals about how to better serve their constituents. Institutions use these insights to:
- Improve IT services
- Increase technology-enabled productivity
- Prioritize strategic contributions of information technology to higher education
- Plan for technology shifts among the various constituencies of the academic community
- Become more technologically competitive among peer institutions, and find out what it might take to compete at the next level
After reviewing the e-learning capability report from the EDUCAUSE Benchmarking Service, Seio pulls out Common's student and faculty results. He cross-references the technologies listed in the capability report with those in the user assessments, pulls the matching results, and aligns student needs with faculty desires (figure 6). He discovers that students at Common wish the faculty would incorporate more collaboration tools for learning and lecture capture into their classes. At the same time, Common's faculty need training and scalable technology for collaborating and lecture capture. The user data was the final piece he needed to conduct a 360-degree assessment of Common's potential to succeed at e-learning.
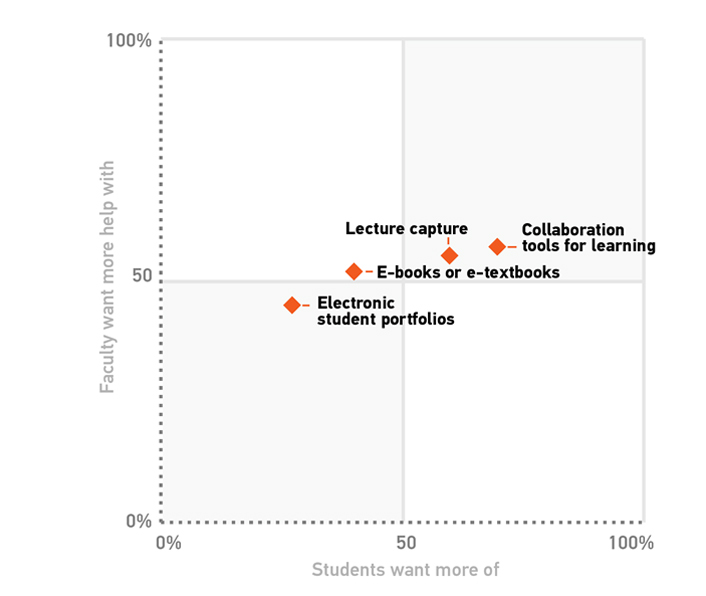
Figure 6. ECAR student and faculty study results
Step 5: Making the Case
With data in hand, the CIO comes prepared to his next meeting with the president. He takes Dent through his thought processes and concludes that a mature e-learning program will be feasible for Common College, provided they make the necessary adjustments. He explains that no initiative will be possible without strong commitment and direction from the top. Some town hall meetings and a marketing campaign should do the trick to show campus stakeholders that the president believes in this new direction. He also proposes that they convene an e-learning governance committee to begin developing policies and procedures for the new initiative. Finally, he suggests some changes to gain efficiencies in the IT portfolio and asks for some one-time funding to support the expansion of basic e-learning infrastructure as well as collaboration tools and lecture capture. President Dent asks about analytics, but Seio assures him that they'll get to that once their house is in order. First things first.
Next Steps
As Common College repositions itself to launch and support a successful e-learning initiative, the changes Seio requested from President Dent shift the college's Culture of Innovation maturity footprint outwards in infrastructure and process, resource allocation, and communication methods. To further this shift, President Dent expands the resource allocation process to include not just key faculty and administrative members but also his CIO, who regularly reports back with the latest analytics showing the college's improving standing versus its peers. As the e-learning initiative gives Common College a stronger marketing pitch, the number of applicants slowly begins to grow, reassuring the board that the college is now moving in the right direction.
For More Information
EDUCAUSE Analytics Services help higher education IT leaders and campus executives make more informed decisions and align IT planning with the institutional mission. Learn more about our trends and forecasts, research and analysis, and benchmarking services. Contact Analytics Services staff at [email protected].
Leah Lang is director of Analytics Services, EDUCAUSE.
© Leah Lang. The text of this EDUCAUSE Review article is licensed under the Creative Commons BY-NC-ND 4.0 International license.
