
Key Takeaways
- Large lecture courses are often required of an institution's newest learners, who lack skills to help them succeed.
- To open alternative paths through these courses, a team at Ohio State University redesigned an intro-level econ course that typically serves more than 600 students at a time.
- Part of the redesign includes offering these students a hybrid flexible (HyFlex) lecture option that lets them choose to experience lectures in the classroom or online through a live stream at a location of their choosing.
- Other technologies reduce logistical overhead, letting instructors spend more time teaching and helping students, and less time dealing with basic questions about course rules, schedules, and so on.
Although routinely offered as large lectures with numerous students, introductory and lower-level courses are often students' first exposure to their university and their department. However, these early learners often lack the skills that more advanced students have developed and may struggle with large-enrolment classes they must pass to progress in their education.
Ohio State University's Economics 2001: Introduction to Microeconomics is a large-lecture course with more than 600 students that fulfills major, minor, and general course education requirements. Course enrollment is heavily weighted to early students, with 70 to 80 percent in their first or second year. As a result, it is especially important that the course provide a high-quality learning experience.
In 2014, one of us (Ida Mirzaie) saw opportunities for improving the course's student experience — and thus student learning — by giving students more choices and by improving efficiency in course management. As the instructor, Mirzaie was inspired to make these changes by the course's logistical demands on her and her teaching assistants (TAs). Contending with these demands had curtailed their ability to individualize learning.
In the summer and fall of 2014, our team began piloting creative uses of online technologies to address these challenges and opportunities, with the support of an Impact Grant from OSU's Office of Distance Education and eLearning (ODEE). As lead instructor, Mirzaie drove the goals of the project and identified the areas of the course most needing improvement. As e-learning coordinator, Griffy helped project manage the revisions and coordinated support from various units around the university. As GTA, Rama helped implement the changes and build new course material and also taught three recitation sections. Several staff and graduate students made other significant contributions to the project. The remainder of this article will describe how we planned, implemented, and assessed these changes.
Goals and Interventions
Our planning process began with a thorough evaluation of the course's status quo and a detailed elaboration of the precise goals for improvement. Moving from an informal wish list to delineated project objectives helped us focus and identify the most effective improvements we could make given the available resources.
Two overarching goals emerged from this process:
- Leverage technology to give students more choice about how to learn by offering more options for engaging with the course and instructors.
- Reduce the course's logistical overhead to give instructors more time and energy to help students learn about economics (and spend less time answering questions about course rules).
Based on research and consultations with several colleagues, we chose three main pedagogical/technological interventions as project objectives to pursue these goals: offer flexible lectures, redesign our learning management system (LMS), and offer new problem-solving options for students.
Hybrid-Flexible (HyFlex) Lecture
We made the course's lectures available to students in a hybrid, flexible (HyFlex) format,1 presenting in-person lectures as a simultaneous Internet live stream using Adobe Connect (see "HyFlex Requirements" for more information on the technologies). In-person lectures were already technology-enhanced through the room's SMART podium in the room, which let Mirzaie incorporate dynamic explanations.
HyFlex Requirements
Based on this and previous Ohio State University HyFlex projects, successful implementation requires the following technologies:
- A video capture/streaming service and a reliable classroom Internet connection
- A presentation computer that can route multiple video and audio sources to the streaming service, especially if instructors show videos or use a drawing device
- A wireless microphone
- Student access to devices and reliable Internet connections
- Course materials reformatted to display clearly on multiple devices at lower resolution
- A committed instructor and responsive IT team
To prepare for HyFlex delivery, Mirzaie worked with ODEE's digital design team to make her presentations easier to read at lower resolutions, which also improved their appearance for classroom students. As figure 1 shows, the presentations included slides that provided canvases for SMART podium-created illustrations.
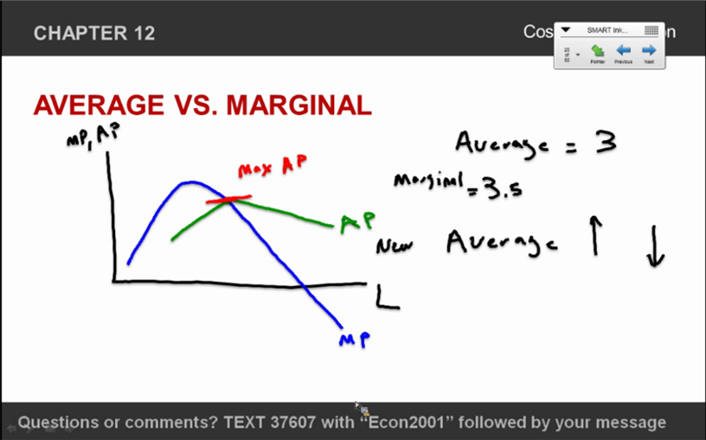
Figure 1. A SMART podium slide from the live-streamed lecture
HyFlex let students choose whether to attend each class in person or via the Internet in a location of their choosing; popular areas with students in the course included campus lounges and the library. A student response system (SRS) recorded attendance and let students ask questions and provide feedback.2 As figure 2 shows, online polling questions quizzed students about topics from each day's material, which gave us feedback on student comprehension and helped us measure how many students attended in person versus online.
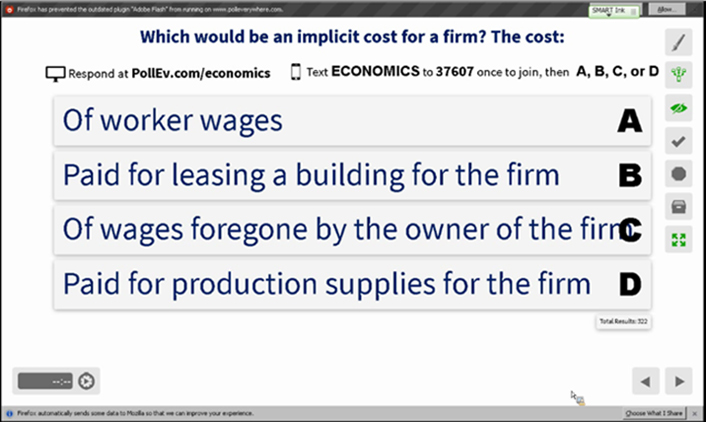
Figure 2. The student response system lets students pose and respond to questions
LMS Redesign
Taking advantage of resources built by ODEE's experienced team of online instructional designers, we redesigned the course site in the LMS to satisfy the Quality Matters Higher Education Rubric standards for fully online courses (figure 3). Material was organized so that students could more easily find both support for learning and answers to logistical questions. Rather than depending solely on delayed personal communication with the instructor — which remained available — students were empowered to find answers to questions on their own (figure 4).
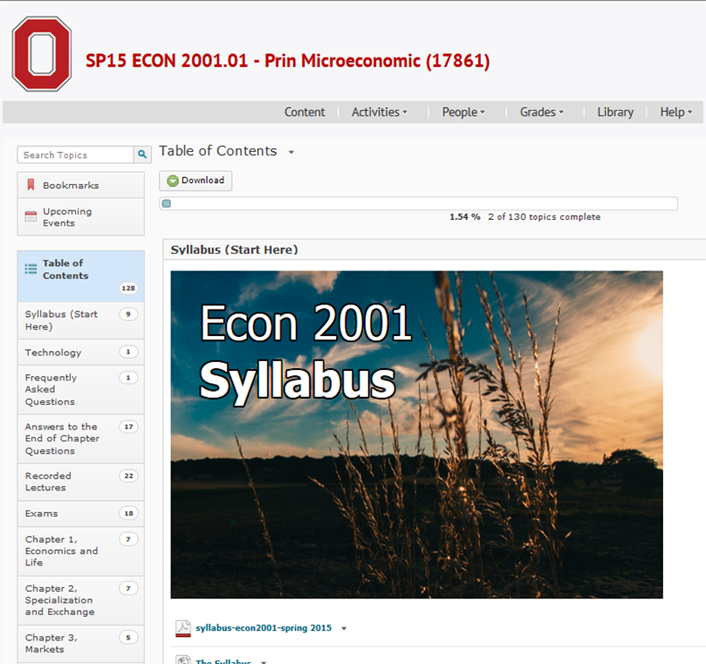
Figure 3. The redesigned LMS site
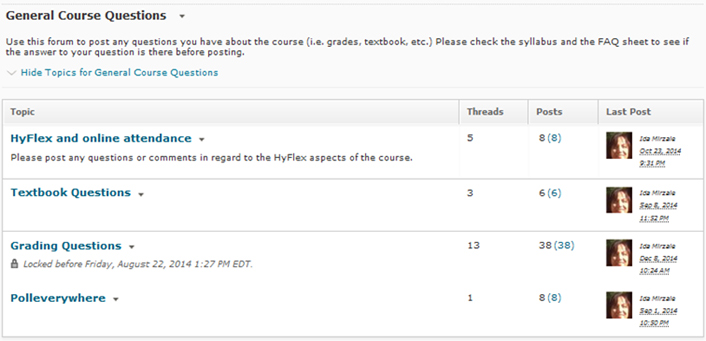
Figure 4. Discussion forums for general course questions
In keeping with Quality Matters' first general standard, for example, we offered the syllabus in multiple formats. We also included
- a new module to provide guidance and access to help for all course technologies, and
- a FAQ section to gather students' e-mailed questions (and instructor answers) in one place (figure 5).
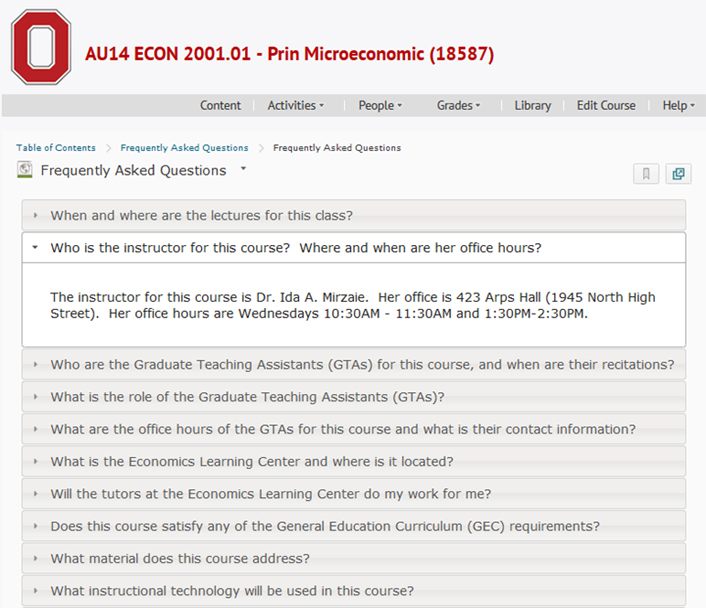
Figure 5. Frequently asked questions
Problem-Solving Options
Research supports the current consensus that students learn better by solving problems than by listening to experts describe problems.3 This insight drove another thread of our course redesign.
The traditional goal for the course's recitation sections was to focus on problem solving and support. We revised the existing problem sets to encourage even more consistent interaction among students. We also developed additional resources for TAs to help them make the most effective and interactive use of this time, including sharing worksheets among all sections and increasing their training in providing problem support.
To increase problem-solving options for students, we offered several online systems that let students gauge their understanding by solving problems on a regular basis with low stakes. First, the course LMS posted weekly quizzes for students (each worth about one percent of the final grade) as well as biweekly problem sets that were auto-graded and could be repeated multiple times, giving students the opportunity to practice, achieve mastery, and earn extra credit. In addition to freeing up time during recitation previously reserved for taking quizzes, offering online problem-solving options meant that students arrived having thought about the material — and instructors had advance knowledge about questions that were problematic for students. This improved logistical efficiency and also gave instructors additional time to offer instruction and provide feedback on students' questions during recitation and office hours.
An online problem-solving platform was also available to students through the course textbook's publisher. Although we negotiated a price reduction with the publisher, the system did require additional payment. Thus, we made sure students were aware of this platform, but we did not feature it as a central course requirement or research its effects.
HyFlex Recitation
During the autumn 2014 (AU14) pilot semester, three recitation sections were offered with the HyFlex option (with 37, 39, and 41 students in each). In these pilot recitations, students could choose to attend in person or via Adobe Connect. In contrast to the HyFlex lecture option, HyFlex for recitation sections was not successful — especially given the effort required to provide it — and we do not recommend it.
Implementing HyFlex for recitations was similar to that for lectures: the recitation instructor's screen and audio were streamed through Connect, and students could attend either in person or by logging into the course from any location. However, unlike lectures, recitations also incorporate group work: students were frequently assigned to small groups to solve problems collaboratively.
Students attending in person were grouped in the traditional way, while students attending online were grouped using Connect's Groups function. In-class students were given paper copies of problem sets, while HyFlex students used PDFs uploaded to Connect; the latter were told to "write" their answers on the PDF using Connect's PDF annotation features. Although group work was successful for students attending in person, it was a struggle for those who attended via Connect. The reason was that online students had to collaboratively edit a single PDF document with members of their group. Because there was a delay before annotations appeared on the document, it was difficult for these students to effectively communicate with each other. This approach created other problems as well. Most notably, we found that collaboration was most effective when students worked in the same groups from week to week. We also found that students worked best with people who were attending in the same mode as they were: online students with other online students, in-person with in-person. Since HyFlex allows students to alter how they attend, it interfered with creating stable working groups over time.
HyFlex recitation was not a failure; that is, it did not harm student learning or fail to provide opportunities to learn. However, it was not cost-effective, it required significant additional effort, and it had both low participation and negative student evaluations. We therefore stopped using it. With a different approach, HyFlex recitation might work, however. For example, it might be more successful given a faster document editor or if online students were encouraged to work with their groups in person.
Technical issues also existed with HyFlex for recitation sessions. Only approximately 40 students could take part in each session. Further, to enable HyFlex, the TAs had to stream their presentations and manage online collaborative work, which required uploading additional materials and managing virtual groups while also guiding in-person problem solving. Bugs and other issues with Connect's Groups feature also required added effort to manage problem solving. Finally, the TAs also had to repeat the Connect setup and management for three sessions a week.
In terms of results, people who attended recitation via HyFlex were typically
- very high-performing students, who understood the material well enough that recitation attendance (online or in person) was of limited benefit; or
- very low-performing students, who would likely to benefit most from the more information-rich interaction available when meeting with a TA in person.
Anecdotally, we did find a few students who periodically used the HyFlex online recitation option because they could not make it to the classroom session. However, the effort required to provide the HyFlex option for these few students would likely provide greater benefit (for them and other students) if that effort were applied to other aspects of the course.
Process Analysis
We planned and implemented the course redesign over a six-month period, with substantial support from departmental and central technology staff. The process borrowed from project management and instructional design.
Spring 2014: Planning
Our team met several times during the spring prior to our autumn pilot to refine objectives and create detailed plans to implement them. The results of this process were a physical project plan and a clearer, shared understanding of the work to be done and the resources required to accomplish it.
In this planning stage, we found project management exercises that helped us refine our scope, identify and plan ahead for risks, and generate a timeline for milestones and deliverables.
Summer 2014: Course Redesign and Testing
During the summer before the pilot, our project team did "the work of the work," which took two primary forms.
First, with guidance from ODEE's instructional designers, the instructional team created new content and updated and modified the existing course content to have the best impact in the new content delivery forms. In terms of new content, examples included
- building more than 450 online quiz questions,
- compiling a few dozen questions and answers from previous terms' e-mails, and
- building problem-based handouts for use in recitation.
Modified content included
- working with OSU's Quality Matters coordinator to rebuild the course LMS site in accordance with QM principles,
- redesigning all PowerPoint presentations using a standard template optimized for streaming delivery, and
- building the online syllabus and technology guide pages.
Second, the support team designed the online systems and coordinated training for the instructional team in how to use them. The details of this work differ radically based on available technologies, but the following aspects of our work can be generalized to any situation:
- We sought help from faculty and staff who had done similar kinds of teaching in the past and invited them to provide both specific how-to information and general coaching.
- We scheduled trainings alongside the instructional redesign work, so that the two work threads could interact with and update each other.
- We scheduled "rehearsals" starting a month ahead of the first day of class, so that nothing would happen in front of students until it had been accomplished successfully. This lead time was especially important because nuances of configuring the room's A/V equipment sometimes disrupted online streaming.
Due to effective planning, the bulk of our work proceeded according to schedule. A few deviations were quickly recognized, and any impacts on project delivery were quickly assessed and handled.
Autumn 2014: Course Pilot
The pilot was successful and unfolded with few glitches during the fall semester. When disruptions did occur, our preexisting relationships with technology support teams were especially important, as they helped us diagnose and resolve issues more easily. The course's technology-enhanced elements were introduced in stages during the first few weeks of the course; this allowed time for student training and gave team members time to respond to any disruptions.
Research and Analysis Overview
We gathered data from multiple sources to enable a complex understanding of impacts. All data were gathered with OSU's Institutional Research Board approval and followed all relevant principles. Results analyzed here include only data from consenting participants. In AU14, 384 of the 588 enrolled students granted consent to participate in research; in AU15, 273 of 666 consented. Following are our data sources:
- Course learning systems. We gathered analytic data from each online system used in the project, including Desire2Learn, Adobe Connect, Poll Everywhere, and TopHat. We then conducted analyses to gather information about student behavior and performance.
- Student information system. We requested limited information from students' registrar records to analyze data for demographic patterns.
- Surveys. We asked students to complete two surveys, one during the first few weeks and one during the final few weeks of each semester's course. The survey questions focused on information not available elsewhere, as well as on perceptions and judgments.
Results: HyFlex Lecture Effectiveness
Our research has continued during the two semesters following the pilot; the following data includes results from the pilot term and the following year's autumn term. Our results indicate that the course's technology-based changes were effective.
Four primary patterns shed light on the effectiveness of HyFlex delivery: student use of HyFlex, grade neutrality, final grade and attendance, and student satisfaction.
Students and Usage
Most important in assessing the project's usefulness is whether students actually use HyFlex; our data show that, when the option is provided, students use it (figures 6–8). Note: In figures 6–8, only exam days and lectures for which HyFlex was available are included.
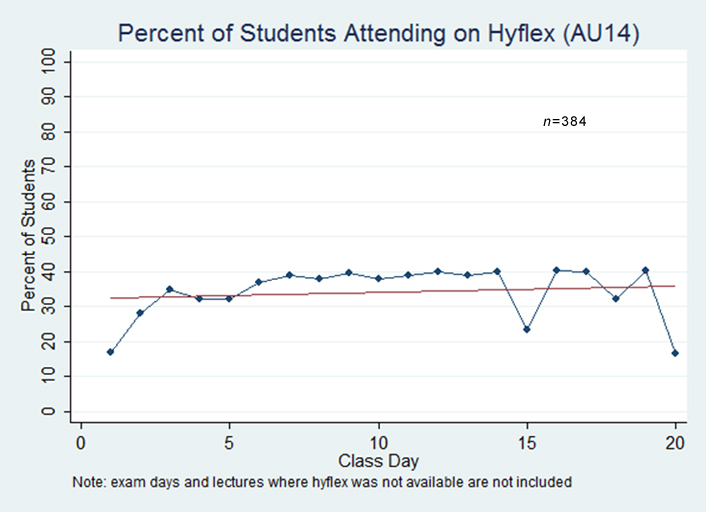
Figure 6. Percent of students attending on HyFlex (autumn 2014)
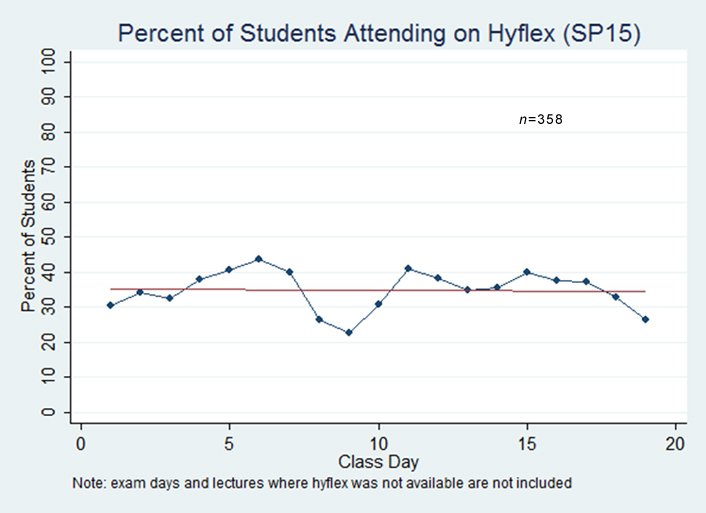
Figure 7. Percent of students attending on HyFlex (spring 2015)
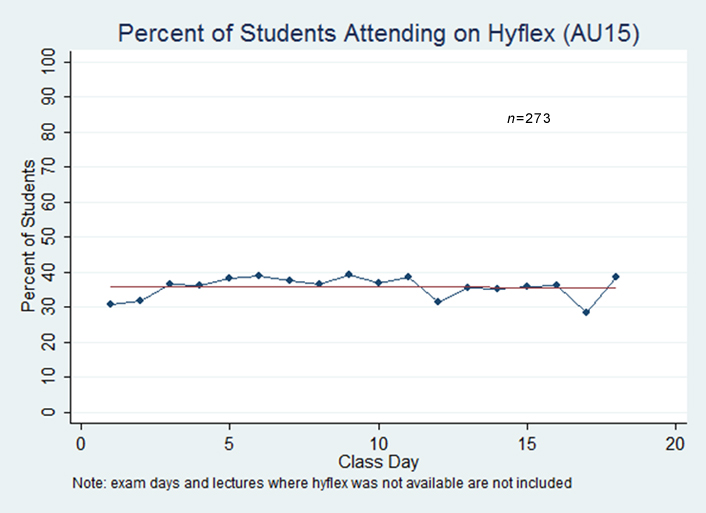
Figure 8. Percent of students attending on HyFlex (autumn 2015)
As table 1 shows, on the days it was offered, HyFlex attendance was approximately 30–40 percent throughout the time period. This suggests that students were quick to realize their preference for HyFlex and were consistent in their attendance style. We classified students as "high attendance" if they attended most of the lectures; "in class" and "online" indicates how students typically attended lectures.
- We determined students to have attended class if they responded to an attendance question in the SRS at a random point during the lecture. We consider students to have attended the lecture "online" if they were logged into CarmenConnect [https://resourcecenter.odee.osu.edu/carmenconnect] (used to stream Adobe Connect lectures) for at least 20 minutes during the lecture time. Absent this login, we assumed attending students were "in class."
- Sixty-five percent of the 588 students in AU14 and 41 percent of the 666 students in AU15 consented to have their data included in this study.
- SP15 is not included because our attendance data did not allow us to differentiate between online and in-class attendance that semester.
Table 1. Attendance Breakdown
|
Autumn 2014 |
Autumn 2015 |
|||
|---|---|---|---|---|
|
Category |
Frequency |
Percent |
Frequency |
Percent |
|
High attendance, in class |
144 |
38 |
132 |
48 |
|
High attendance, online |
63 |
16 |
82 |
30 |
|
Low attendance, in class |
140 |
36 |
56 |
21 |
|
Low attendance, online |
37 |
10 |
3 |
1 |
Note that the "in class" versus "online" classification is somewhat error prone because students sometimes watched the lectures online with their friends without logging into their individual accounts, and we would have no record of their having watched the lecture online; we would simply assume they attended in-person if they answered the attendance question or were absent if they did not answer the question. Also, students who attended the lecture in person sometimes logged in to watch online, and would thus show up in the data as having attended online even though they were in class.
Our end of semester surveys showed that 66 percent of students attended lectures online as often or more often than they originally expected. Slightly more than half of the sample attended the majority of the classes. Among the high attenders, about two-thirds attended in person, while the rest attended using the HyFlex option. Among the low attenders, more than three quarters attended the course in person while the rest attended using the HyFlex option.
Grade Neutrality
We analyzed correlations among attendance, mode of attendance (in person versus HyFlex), and student performance (course grade). Attendance for a given lecture was determined based on whether or not the student responded to an attendance question posed in class via the electronic SRS. We characterized students as having "high attendance" if they attended a majority of lectures. We determine students to have attended a lecture online by looking at when they logged into CarmenConnect. If students attended the majority of lectures online, we characterized them as being "high online."
We calculated students' final grades based on the grading scheme provided by the instructor. In AU14, the breakdown was 10 percent quizzes, 15 percent homework, and 75 percent exams (the highest three of the four exams taken). In spring 2015 and autumn 2015, the breakdown was 10 percent quizzes and 90 percent exams, with homework available for practice. We found no performance difference between those who attended online versus those who attended in class.
Final Grade and Attendance
The distribution of students with high attendance is higher than those with lower attendance. However, among the high-attending students, we found no statistically significant difference in grades among those who primarily attended online versus in class. This suggests that students are appropriately self-sorting into the correct learning option, resulting in similar scores among high attenders (see figures 9 and 10).
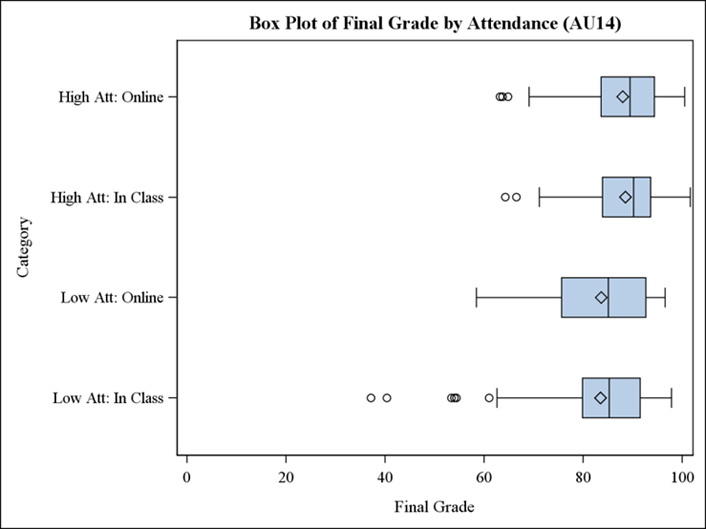
Figure 9. Final grade by frequency and mode of attendance (autumn 2014)
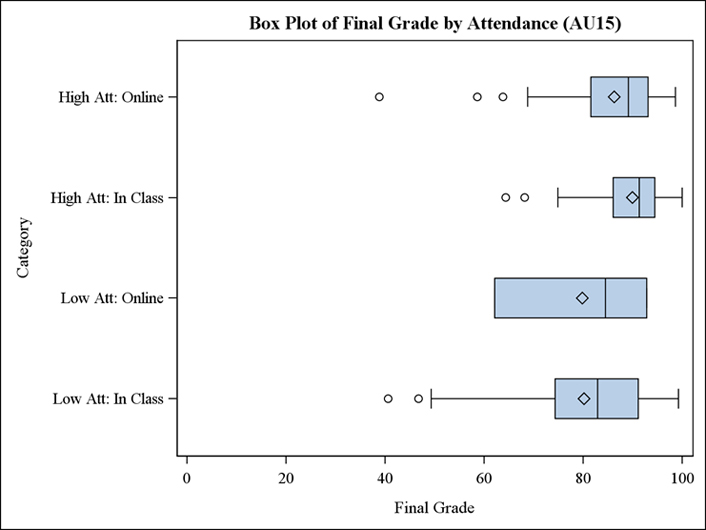
Figure 10. Final grade by frequency and mode of attendance (autumn 2015)
Student Satisfaction
The fact that many students attended online provides prima facie evidence of their liking for that mode of learning. Survey data reinforce that supposition. Surveys given during AU14 and SP15 (n = 554) showed that
- 85 percent agreed that "having course lectures available to me via Adobe Connect helped me learn,"
- 80 percent agreed that "instructional technology used in this course helped me learn,"
- 77 percent agreed that "listening to recorded lectures helped me to understand the concepts better," and
- 75 percent agreed that "the use of [student response] to ask questions during lectures helped me learn."
Results: Revised LMS and Practice Systems
Research data provides limited objective data about student reception of the revised LMS; however, anecdotally, students spoke well of the new organization (when they spoke of it at all) and the volume of student questions about course matters dropped significantly. Given that student ease of use and logistical efficiency were the main goals of the revision, this drop in the number of help e-mails was perhaps the most telling sign of success, though we did not design it into our research protocol.
LMS and Online Practice
A majority of students completed each quiz across all three semesters, despite quizzes being worth only 10 percent of the final grade, indicating that students found them a worthwhile investment of time (see table 2). The percent of completion does decrease a bit for quiz 8 in AU15, quizzes 8 and 9 in SP15, and quiz 9 in AU14, most likely because these came late in the semester, and three of the lowest quiz grades were dropped.
Table 2. Percent of students who completed online quizzes
|
Quiz |
||||||||||
|---|---|---|---|---|---|---|---|---|---|---|
|
Semester |
No. of students* |
1 |
2 |
3 |
4 |
5 |
6 |
7 |
8 |
9 |
|
Autumn 2014 |
384 |
91 |
97 |
96 |
93 |
93 |
94 |
93 |
91 |
87 |
|
Spring 2015 |
358 |
95 |
92 |
88 |
92 |
90 |
85 |
90 |
85 |
85 |
|
Autumn 2015 |
273 |
95 |
92 |
94 |
89 |
91 |
89 |
90 |
81 |
92 |
|
*The number of students includes only those who consented to have their data collected; the actual number of students in the course is nearly 700. |
||||||||||
Quiz and Total Exam Grade Correlation
Total quiz grade and total exam grade were positively and significantly correlated, suggesting that students who performed better on quizzes continued to do better on the exams either because the quizzes assisted in their learning or because both the quizzes and exams reflected students' general understanding of the material. It also suggests that students were doing their own work on quizzes rather than entering answers acquired from other sources.
In table 3 we define the various terms as follows:
- "Total quiz completion" refers to the total number of quizzes completed out of the nine possible.
- "Total quiz grade" refers to the students' total quiz grade, which excludes the three dropped quizzes.
- "Total exam grade" refers to the average of students' top three exam grades out of the four exams taken (midterms 1–3 and the final exam).
Table 3. Correlation between quiz completion, quiz grade, and total exam grades
|
Autumn 2014 |
Spring 2015 |
Autumn 2015 |
|
|---|---|---|---|
|
Correlation: number of quizzes completed and total exam grades |
0.2705*** |
0.3787*** |
0.3099*** |
|
Correlation: total quiz grade and total exam grades |
0.4627*** |
0.5419*** |
0.4574*** |
|
*** If p-value < 0.01 |
|||
LMS Use
All students used the LMS in some fashion, and the distribution of usage indicates a wide range of patterns. Having been provided with many options, students accessed content in multiple ways and through various paths.
Satisfaction with Online Systems
Course surveys indicated that students appreciated the technological additions to the course:
- 80 percent of students agreed that "Instructional technology used in this course helped me learn,"
- 76 percent agreed that "Instructional technology helped me engage with the content of this course," and
- 60–84 percent agreed that problem assignments (84 percent), additional lecture (84 percent), discussions (82 percent), and group work (60 percent) helped them understand the course concepts.
These numbers gain additional meaning when contrasted with two other survey results on the interactions of technology with the course community. One of our goals for future course development is to organize opportunities and foster collaboration among students; however, in this project, available resources made that objective outside the project's scope. As expected, student responses on the survey did not reflect strong social engagement in the large-course format:
- 61 percent agreed that "Instructional technology helped me engage with the instructor of this course," and
- 46 percent agreed that "Instructional technology helped me engage with my peers in this course."
Students felt, in other words, that technology helped them learn independent of the course's social organization.
Logistical Improvements and Efficiency
The logistical impact of technology also seems to have succeeded. The lead instructor and all TAs reported that students contacted them less frequently about basic course information and questions unrelated to content. Analytic evidence supports this perception; virtually every student accessed the LMS at some point during the semester, which is rarely true in other courses.
Discussion
Based on multiple threads of research, our most consistent finding is that HyFlex delivery and other hybrid pedagogies can help a mega-lecture course provide active and individualized learning without reducing learning. The stereotype is that technology is an obstacle to interactions, creating distance between students and preventing instructors from responding to students' varying needs and learning styles. However, this research demonstrates the opposite: in large lecture courses, which traditionally limit instructors' logistical ability to tailor learning experiences to individual learner's needs, technology can introduce customizable options that are otherwise infeasible.
This course's use of the SRS illustrates this possibility. When hundreds of students attend an hour-long lecture in person, having more than a few students pose questions is simply not an option. So, while recitation and office hours provide opportunities to pose questions, the lecture necessarily remains a largely one-directional experience. Using an SRS that accepts text submissions throughout each class establishes a two-way channel between students and instructors. Instructors can use the SRS to both ask and answer questions. Further, students can use the SRS as individuals as well as in a group, comparing their level of understanding with their peers during lectures.
HyFlex delivery also introduced unanticipated opportunities for interaction and community to emerge. Some students, for example, gathered in small groups in their dorms to watch the lecture on TV, while others brought their computers to class and watched the slides up-close using CarmenConnect in the lecture hall. In more ways than we anticipated, HyFlex let students enrolled in a massive in-person course change the course's size to suit them. It also reduced the noise and crowds in the lecture hall itself as hundreds of students chose distant attendance. Finally, the recorded lectures helped students catch up if they missed a class or simply wanted to watch a lecture again for clarification.
Conclusions
Giving students multiple options to practice their learning — problem-based recitation, online quizzes, online homework, and the online publisher's site — let them tailor their learning experience to their individual needs and preferences. The course delivery also offered logistical benefits, opening up time previously spent on quizzes for additional instruction. Likewise, other logistical improvements and streamlining of instructional overhead freed up time traditionally spent answering questions about timing, policies, and other basic information to enable instructors to focus on the subject at hand.
The system is still new, and its occasional glitches require patience and persistence. With any such system, you should inform students in advance about the possibility of unexpected problems, such as network connection slowdowns caused by an increase in remote-access students. Nonetheless, as this project demonstrates, technology can help instructors teach the subject, rather than the course, and can help students experience the benefit of smaller courses while enabling departments to continue the benefits and efficiencies of large-enrolment courses.
Notes
- For more about HyFlex Delivery, see "7 Things You Should Know about HyFlex Course Delivery," EDUCAUSE, November 9, 2010; "What is a HyFlex Course?" Key Concepts blog, Touro College, December 30, 2013; and Brian Beatty, and several posts on "The HyFlex World," blog.
- We used the Poll Everywhere student response system to collect information on student attendance and to encourage engagement by asking students questions during the lecture.
- Eric Mazur is a vocal and persuasive researcher on this topic. His talk, "Confessions of a Converted Lecturer," argues the case powerfully, as do several publications available at his website.
Ida Mirzaie received her PhD in economics from the University of Wisconsin in Milwaukee in 1999. She joined the Ohio State University in 2000 where she is a senior lecturer in the department of economics. In addition to teaching principle of economics, she teaches courses in money and banking and international economics. She has also worked at John Carroll University in Cleveland and DePaul University in Chicago teaching undergraduate and MBA level courses. Her research has been published in referred professional journals. Number of her research has been published as IMF working papers and also as chapters in different edited books.
Henry Griffy received his PhD in medieval English literature from the Ohio State University in 2013. He is currently instructional designer and Professional Development Support Liaison at the Office of Distance Education and eLearning at the Ohio State University, where he assists online faculty gaining and improving skills necessary to provide high-quality online learning. He previously taught courses in early English literature and first-year composition as a GTA at OSU and the University of Oklahoma.
Apoorva Rama is an Economics PhD student at The Ohio State University.Her research deals with workers transitioning from college to the labor market, specifically focusing on wage returns to skills developed through schooling and occupation mobility of recent graduates. During her time in graduate school, she has served as a research assistant, teaching assistant, and instructor. Her teaching incorporates new technologies in order to encourage student interaction in the classroom and to enhance student learning and productivity outside of lecture.
© 2016 Ida Mirzaie, Henry Griffy, and Apoorva Rama. The text of this EDUCAUSE Review article is licensed under the Creative Commons BY-ND 4.0 license.