
Key Takeaways
- These guidelines to service metrics explain what to measure and how, when, and why to measure it.
- Trends reveal the most about services and performance, alerting an IT department to problems as they develop or to success in their service delivery efforts.
- Service subscription rates and customer surveys provide the best metrics for identifying trends because the only way to know what customers think about your organization's ability to deliver services is to ask them.
- Do not gather a bunch of metric data just because you can — start with high-level service goals and then identify the metrics that can help gauge how well those goals are being met.
As IT service providers, we all know how important it is to develop good metrics. Without meaningful measurements, how are we to gauge our level of performance — and thus how we improve — at delivering the services most needed by our customers? And, yet, it seems that so few of us are doing this correctly, if at all. In order to deliver the most value to our institution, we must know:
- which services will do that in the first place (something that is always shifting),
- how efficiently and effectively we deliver those services (to be competitive with alternatives), and
- how adequately we manage and monitor services — to maximize our provisioning and support capacity — and respond to growth in demand.
Know the Vernacular: Metrics vs. Measurements
These two terms are not interchangeable, and a lot of people get them confused with each other, but it is important that we all speak the same language. This is really straightforward, actually. Metrics are the things you want to measure — the variables. Measurements are the actual data — the values. As a simple example, height is a metric, and 6'2" is a measurement. That example metric, and the measurements taken over time, can be used to determine, for instance, how fast a child is growing (or to identify some other trend). Trends — the real value in all of this — are discussed in more depth further below.
The Four Critical Categories of Metrics
While some might argue that there are more, I have found that almost every meaningful metric falls into one of four high-level categories: (1) Capacity, (2) Performance, (3) Relevancy, and (4) Satisfaction. The first two types are typically gleaned via operational measurements: instrumentation, monitoring, and logging. The latter two types are best gleaned via customer feedback: subscription rates and satisfaction surveys. They are all truly critical, and somewhat interwoven, but let us look at each one independently:
- Capacity generally refers to quantity — how much of a finite resource is being consumed. In the case of IT service metrics, this resource is a service (or an identifiable, finite piece of a service, such as infrastructure). How much bandwidth is being consumed? What is our CPU usage? How much disk space or memory is being used? (And, of course, how fast are these numbers growing?)
- Performance, in the context of IT services, is mostly about uptime and reliability, but it is also often used to measure how "healthy" (fast, error-free, etc.) a service is. How many nines of uptime have we achieved? How quickly did the data arrive? How many packets were lost? What is the quality of the service? Are we meeting the performance expectations identified in our service level agreements?
- Relevancy gauges how dependent your customers are (or their work is) on a particular service. This metric is critical in terms of distinguishing levels of importance and thus prioritizing services — which ones you should continue to provide and, perhaps more importantly, which ones you should not (or which ones you should change to better meet your customers' needs).
- Satisfaction should be pretty self-explanatory. This is how satisfied your customers are with a particular service — how they perceive your delivery of it, or their level of gratification. Without this metric, you are only guessing at how well your service delivery is received by customers. Of course, this metric applies only to the services that customers deem most relevant to them. (No need to ask, obviously, how satisfied someone is with a service having little importance to his or her job.)
The Importance of Continuous Measurements for Trending
Metrics are the means to an end, or, rather, the means to a trend. While each of these categories is critical, the slope of the lines plotted across time tell you the most about your services. Is the service moving toward more importance or less? (Is it time to dedicate more resources to the service, or plan its end?) At what rate are the service's resources being consumed? Are we getting better or worse at delivering it?
Taking a measurement in time of a satisfaction score, for example, might yield an average score of seven on a scale of one to 10 (with one being poor and 10 being excellent). While seven might seem like a decent average score on its own, it could be a sign of serious trouble if the past several average scores have been nines and 10s, or a welcome sign of improvement if the past several average scores have been extremely low. Which kind of attention (or celebration) to give that average score of seven is totally based on the context gleaned from the trend.
Knowing when to end services (one of the most significant challenges in IT organizations), how to manage just-in-time (optimal) resource growth, how much to focus (resources) on improving service provisioning and/or customer service skills in general, and understanding the overall fitness of your service management (and service portfolio management) processes all comes down to metrics-based trends.
A Valuable Tool: The Service Survey
As mentioned, service subscription rates and customer surveys provide the best metrics for identifying trends to gauge service relevancy. And the only sure way to know what customers think about your organization's ability to deliver services is to ask them. All you need is a simple, consistent, regularly scheduled survey that asks two critical questions for each service that can be ordered from your service catalog:
- How much does your work depend on having this service?
o Couldn't do my work without it
o Very important to my work
o Somewhat important
o Not very important
o Not important at all
o I don't use this service in my work - How satisfied are you with this service?
o Very satisfied
o Somewhat satisfied
o Neither satisfied nor dissatisfied
o Somewhat dissatisfied
o Very dissatisfied
o I can't judge
Additionally, depending on how centralized your IT organization is, you might want to ask some questions to segregate the results into appropriate demographics. For instance, if you are the central IT service provider for your institution, you will want to differentiate between the feedback of your institution's other IT service providers (who might serve as liaisons between you and their department's end users) and that of true end users. You might have totally different staff serving these two different constituencies, or a different provisioning process for each of them, so looking at this data separately makes a lot of sense.
What's the Frequency?
The frequency with which you take measurements is critical to maximizing the meaning of the trends produced from the data. If measurements fluctuate dramatically (i.e., have a high standard deviation), they need to be recorded more often to minimize the likelihood of drawing the wrong trending conclusions. More importantly, you want to ensure that you can react appropriately to trend changes in a timely manner. So, the frequency of your measurements needs to account for the time you might need to take action (increase capacity, add redundancy to deal with an availability issue, improve customer service training, or even kill a service).
In terms of the relevancy and satisfaction survey, the IT department should balance the need for frequent measures with not asking too much of customers (by over-surveying them). One solution is to divide your customer base into 12 groups and survey one group per month, thereby surveying every individual only once per year, but still gathering monthly points on the graph towards more rapid trending. Of course, this assumes that your customer base is large enough so that one-twelfth of it would still provide reasonably large sample sizes and thus statistically reliable results.
A Fifth Metric Category
In addition to the four critical categories of metrics, some people count costs among the set of formal metrics that help expose important IT service trends. IT cost metrics can include financial measures such as labor, software licensing costs, hardware acquisition and depreciation, and data center facilities charges, all mostly obtained from general ledger systems, and combines these with operational data from ticketing, monitoring, asset management, time tracking, and project portfolio management systems to provide a single, integrated view of IT costs by service, department, GL line item, and project. Costs should further be broken down between capital (one-time) and operational (ongoing) costs. In addition to tracking all of these costs, combining them with usage and operational performance metrics can provide a measure of value or return on investment. Costs, budgets, performance metrics, and changes to data points tracked over time can identify trends and the impact of changes to underlying cost drivers, helping managers address the key drivers in escalating IT costs and thus improve planning.
Storing Measurements and the Grand Scheme of Things
Besides collecting, and gleaning meaning from, metrics, one of the challenges many IT organizations face is being able to summon and share those metrics when needed/requested. This is a critical part of using metrics successfully, as IT organizations are often large and complex, with completely different employees or groups supporting different services.
It is important to recognize the hierarchical relationship among metrics and two other fundamental service resource layers: (1) the service catalog/portfolio and (2) service level agreements or, often, operational level agreements (SLAs/OLAs). To be clear, the service catalog is a public-facing menu of orderable services, and the service portfolio is a more internal superset of the service catalog that contains services (internal, retired, etc.), service attributes, and detailed data not typically present in the catalog. SLAs are the performance and response commitments made to customers of the service, and OLAs are agreements between IT service providers that address roles, responsibilities, and response commitments. Metrics should be leveraged to support SLAs/OLAs and, of course, also support other service measurements more directly. The aforementioned hierarchical relationship is a one-to-many-to-many structure:
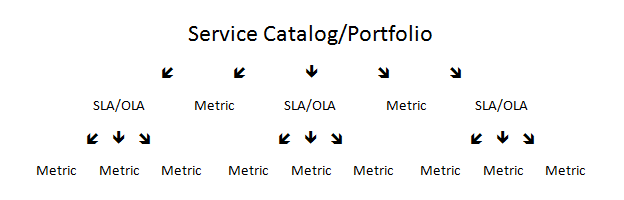
In addition to storing detailed metric data in the service portfolio, a higher-level view of metrics and metric trends are often made available in the service catalog. In essence, they demonstrate that you are meeting the service levels to which you have committed and measuring other important aspects of the service. Perhaps equally important, the service catalog thus provides a single authoritative source of metrics for both customers and service owners.
A Few Words of Caution
There are two risks, even dangers, of which to be cognizant:
- First, developing metrics to enable better, data-driven decisions around a service needs to be approached in a top-down fashion, with SLAs/commitments (and perhaps other service goals) driving what you collect. One of the major rookie sins of defining and gathering metrics is to start with those that are simply easy to gather, in which case you can certainly end up with voluminous amounts of data, very little of which may actually be useful. Instead, start with your service goals — SLAs/OLAs, provisioning efficiency, customer satisfaction, and so on — and then identify the metric data that will help you gauge how well you are meeting those goals.
- Second, developing the processes and structures for gathering, storing, analyzing, and sharing metric data requires a monumental effort. The last thing you want to do is not respect the metrics, i.e., go through all of this effort only to end up not using the results. More than just a waste of time, this will create a huge morale issue for those employees involved in the effort, as well as for service subscribers/customers who would benefit from it. Act on the metrics and metric trends you expose — limited resources demand that actions have a purpose, and that a purpose results in action.
Summing Up
Do not gather a bunch of metric data just because you can. Start with your high-level service goals and then identify the metrics that can help gauge how well those goals are being met. Remember that trends and trend changes tell the real stories, help IT adequately grow (or shrink) services, and ultimately maximize IT's effectiveness and efficiency in delivering the important services on which almost every business process of the institution depends.
© 2013 Mark Katsouros. The text of this EDUCAUSE Review Online article is licensed under the Creative Commons Attribution-NonCommercial-NoDerivs 3.0 license.