
Key Takeaways
- A study of 177 postsecondary institutions found that central IT organizations pay student IT workers lower wages, on average, than distributed IT organizations.
- With the exception of Network Infrastructure and Services, tasks performed by student workers are much the same across both central and distributed IT organizations.
- Student IT workers at urban institutions earn more than those at rural institutions, and student IT workers at research institutions earn more than those at either master’s or four-year institutions.
- Statistically significant wage differences were not found between public and private institutions or between institutions located in different geographical regions of the United States or international institutions.
Motivation
Audio & Transcript: Student Wage Potential Motivation
You are missing some Flash content that should appear here! Perhaps your browser cannot display it, or maybe it did not initialize correctly.
Listen to a conversation between AJ Kelton and David Stack as they discuss their motivation for undertaking this study.
AJ Kelton: We were having an issue here with a perception that our IT department had deeper pockets and they were able to pay the student assistants more and so they were draining the pool. And so we weren’t at the time able to get the good student assistants on campus. I think your contention was that actually the distributed units had a better ability to get better students because of some of the flexibility within the units. I guess the argument was sort of that the smaller organization is more agile, and so that’s what prompted us to say, well, if I think it’s one way and you think its exactly the opposite, then obviously there are other people out there who are probably thinking the same thing. So we wanted to get a good pulse from the community.
David Stack: Right, well, I remember when we started the initial discussion, I had felt that we’d seen from the central IT perspective times when some of our best students were sort of siphoned off to the departments, schools, or colleges in the distributed IT shops because they could dangle a higher wage in front of the students, and we were trying to have sort of a very kind of uniform wage pattern where if you worked so long and you’d had so much training and you gained so much merit, you would make X dollars. But, somebody could come along from a school or college and say to the student — someone that they knew was really good — “What are you making? You know I’ll pay you a buck or two more an hour for that.” And, of course, if we tried to keep up with those kind of wage pressures with 200 students working about half time, you give everyone a 25-cent wage increase and all of a sudden that turns into a lot of money. So we felt that some of our students were kind of getting cherry-picked.
In a time of scarce resources, it is counterproductive for an institution to artificially inflate student wages via internecine struggles between central IT services and similar, distributed services in university departments. The pressure to inflate student wages might be exacerbated by similar but opposite viewpoints on the part of supervisors, however. For example:
- Central IT tends to believe that academic departments can afford to pay a small number of students excessive wages and thereby drive up the campus wage scale.
- Distributed IT units perceive central IT as having deep pockets and therefore able to pay high wages the departments can’t match.
After expressing these opposing viewpoints on the EDUCAUSE Distributed Technology Support Constituent Group electronic discussion list, AJ Kelton and I circulated a survey designed to investigate the issue and uncover the institutional factors that might cloud a simple comparison of wage amounts.
Methodology
Audio & Transcript: Student Wage Potential Variables
You are missing some Flash content that should appear here! Perhaps your browser cannot display it, or maybe it did not initialize correctly.
Listen to a conversation between AJ Kelton and David Stack as they discuss their selection of variables for the survey. Also, view the survey instrument.
AJ Kelton: What was interesting to me I think then, and even now, is that I had on this end — and I guess it really depends upon the structure of the organization — we were in exactly the same situation that you were in except on the distributed side. We couldn’t pay the students enough money.
David Stack: Yeah, as far as some of the things we looked at back then as we discussed our two institutions and what might affect things were whether an institution was public or private; its mission as to whether it was a two-year, four-year, doctoral, whatever; whether it was an urban or rural or suburban neighborhood; or what part of the country — and that was kind of a very challenging thing because we couldn’t find any particular rubric for that, so we just kind of made up our own and let people sort of self-identify on all these things. If you thought you were in the West, you’re in the West because you should know if you’re in the West or not, for example.
Kelton: You wanted to determine if it really wasn’t necessarily whether someone was a private or a public institution or whether someone works in the Midwest or whether they worked on the East Coast or in a big city or whether they were central IT or distributed IT.
In 2007, Kelton and I received 177 valid responses to a voluntary student wage survey that was distributed to more than a dozen electronic discussion lists sponsored by EDUCAUSE, the Society of College and University Planners (SCUP), and other professional organizations. In addition to questions regarding wages, the survey asked respondents to report:
- Their purview as central IT or distributed IT
- Public or private control of their institution
- Their institution’s mission
- The type of neighborhood surrounding their institution
- The region of the country in which their institution is located
- The tasks performed by their student workers
The demographic question on institutional mission was not based on the Carnegie classification scheme because of concerns that the rubric would not be familiar to all respondents. Instead, respondents were offered the less rigorous choices of associate, vocational, two-year, four-year, baccalaureate, master’s, doctoral, and research.
Since Kelton and I could not find a commonly understood taxonomy for which states lie within various geographic regions within the United States, we provided a set of terms and let the respondents self-identify their region. We considered asking the respondents to indicate their state and then aggregating the states into regions during the analysis phase, but chose not to in order to ensure that the individuals who responded could remain anonymous and that their institutions could not be inferred via a combination of the variables state, purview, control, mission, and neighborhood.
The respondents were asked to identify the tasks performed by their student workers to determine whether differences in the types of student work performed in central versus distributed IT organizations could have a bearing on wages. Rather than soliciting free text responses, which would have been problematic to analyze, the survey instrument provided respondents with the same choices as the EDUCAUSE Core Data Service, but without the lengthy definitions for the terms. The intent was that the Core Data Service categories would guide the respondents into using a common set of terms rather than multiple synonyms for similar tasks. The responses indicated whether each task was performed or not performed by the students in the respondent’s organization. Respondents were not asked to estimate the percentage of effort applied to each task either by individuals or by their entire student cohort.
One potential variable not investigated was whether the students were paid through the Federal Work-Study Program, in which administrators have “substantial flexibility” in setting hourly wage rates.
Analysis and Discussion
Audio & Transcript: Student Wage Potential Findings
You are missing some Flash content that should appear here! Perhaps your browser cannot display it, or maybe it did not initialize correctly.
Listen to a conversation between David Stack and AJ Kelton as they discuss the survey findings. Download the deindentified survey data.
David Stack: In the analysis, in which I got a lot of help from here from some statisticians, was that distributed IT did pay a significantly — statistically significantly — greater wage than central IT of about — not a lot — $8.82 an hour versus $8.18 an hour. And in looking at the different types of institutions — research, doctoral, masters, etc. — there was a significant difference between research and master’s institutions, with the research institutions paying more, and between research institutions and four-year institutions, again with the research institutions paying more. And, as you just bring up now, maybe some of that is because maybe some of those students were on grants, which, as you say, is not a question that we asked. The other significant statistical difference was between urban and rural institutions. The rural institutions only paid $7.45 compared to urban, which paid just over $9.00.
AJ Kelton: The cost of living.
Stack: Yeah, and suburban was right in the middle, and the difference was not statistically significant either up or down to either of the others. The one that surprised me though, and I know we spent so much time trying to figure out how to classify different parts of the country, is that there didn’t seem to be any interactions any which way between different parts of the country or international institutions. It was more, what was your neighborhood, what was your… what type of institution are you at, and are you in central IT or distributed IT?
Kelton: And I suppose that probably makes a lot of sense because when we say the Midwest are we talking about podunk or are we talking about Chicago? Chicago is not going to be statistically different than Manhattan or Dallas or L.A. So I suppose the more telling wasn’t necessarily – and it’s interesting that I was the one who really pushed for that question — that statistically that’s irrelevant; what was more relevant was whether they considered themselves urban, suburban, or rural. That’s much more telling.
Stack: We know that these were all possible factors that could influence it one way or the other, and that’s what the results show: location, location, location, more on the small scale than on the national scale.
The survey results were analyzed with the assistance of the Consulting Office for Research and Evaluation (CORE) in the School of Education at the University of Wisconsin–Milwaukee.
Response Rates
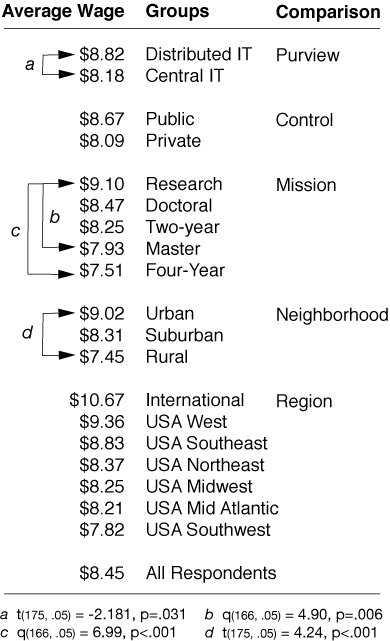
There were somewhat more responses from CIOs and managers of central IT operations (59 percent) than distributed IT operations (41 percent). More public institutions (62 percent) responded to the survey than private institutions (38 percent). Because of low response rates from certain types of institutions, responses were combined from institutions with associate, vocational, and two-year missions. Similarly, responses from four-year and baccalaureate institutions were combined. Table 1 shows significant differences (a, b, c, and d) in average wages paid to student IT workers at various types of institutions.
Table 1. Wages for Student IT Workers
Purview
On average, distributed IT pays statistically higher wages than central IT (a in Table 1), which appears to confirm the notion that distributed IT units can afford to pay higher wages than central IT, perhaps to retain valuable employees.
Control
The widespread softening of funding support for public institutions of higher education has not resulted in student IT workers making statistically lower wages than their private institution peers. Perhaps at many public institutions, students work to earn a substantial portion of their living expenses; if so, the institution cannot control expenses by underpaying student employees.
Mission
A significant difference in average wage was found between research institutions and master institutions, as indicated by b in Table 1. A significant difference was also found between research institutions and baccalaureate institutions, as indicated by c in Table 1. It is interesting that significant differences were not found between doctoral and master’s or baccalaureate institutions. Perhaps those respondents who described their campuses as research as opposed to doctoral were from some of the wealthiest institutions.
Neighborhood
The survey respondents were asked to characterize the neighborhood that surrounds their institution as urban, suburban, or rural on the supposition that the local environment could influence wages in two respects:
- The presumably higher costs of living in denser environments would likely push wages higher for all local employers, including campuses.
- A denser environment would likely offer students more alternatives for employment, resulting in the campus paying higher wages to be an attractive choice.
Indeed, the data show that students are paid the highest wages at urban institutions, but only the comparison with the lowest wages at rural institutions is statistically significant (d in Table 1).
Region
When the study was conducted in 2007, we expected that the data would yield wide variances in the average student wages paid in different geographic regions of the United States and internationally. Although the highest average wage shown in Table 1 — for international student workers — is 36 percent greater than the lowest average wage — paid to students in the southwestern U.S. — the differences between regions are not statistically significant. The lack of significance might reflect the small sample sizes for some of the regions. Another possibility is that, aside from the aforementioned urban-rural wage difference, higher education institutions comprise a somewhat closed environment that is not highly sensitive to regional economic conditions.
No statistically significant interactions were found among the three variables of control, neighborhood and region — all p values were greater than 0.05.
Tasks
Figure 1 illustrates the responses from central IT and distributed IT regarding the tasks performed by student IT workers. The responses from both groups are quite similar across the various tasks; typically within 10 percent with the exception of Network Infrastructure and Services, for which the central IT response rate was 14 percent higher. This is not surprising given that campus network infrastructures typically fall within the purview of central IT.

Figure 1. Central and Distributed IT Student Worker Responsibilities
Conclusions
The data from the survey on wages for IT student workers revealed some significant differences:
- From an hourly wage perspective, a student employee is likely to be better off working for a distributed IT organization in a campus department than working for the institution’s central IT organization.
- A student working at a research institution can expect to be paid more than one working for a master’s or four-year institution.
- A student working at an urban institution is likely paid more than a student working at a rural institution.
Student workers might want to consider these results when applying for positions in central or distributed IT at their chosen universities.
Acknowledgments
The author wishes to thank AJ Kelton, the Director of Emerging Instructional Technology for the College of Humanities and Social Sciences at Montclair State University in New Jersey, for engaging in this study and contributing his comments to the audio clips. He is also the Second Life Project Coordinator for the College of Education and Human Services at Montclair State University.
Many thanks to Alan Schnebly and the Consulting Office for Research and Evaluation (CORE) in the School of Education at the University of Wisconsin–Milwaukee for generous assistance with the data analysis.
Thanks also to Amy Mangrich of the Learning Technology Center (LTC) of the University of Wisconsin–Milwaukee for assistance in processing the audio dialogues.
© 2009 David Stack. The text of this article is licensed under the Creative Commons Attribution-Noncommercial-Share Alike 3.0 license.