
Publishing key data points about the transition to synchronous teaching and learning is helping Arizona State University to be more transparent about the work that is being done to support students and faculty.
The best thing about working for Arizona State University (ASU) is its charter. If I or any other ASU staff member is ever unsure about why we do what we do, we just refer back to this statement about inclusion and success. That's never been more true than it's been over the last few weeks as the university transitioned to synchronous teaching and learning. ASU staff have expressed their commitment to the charter through the work they have put in during these trying times. While the bulk of the attention is rightfully focused on students and instructors, there is also a tremendous amount of work going on behind the scenes in IT departments everywhere.
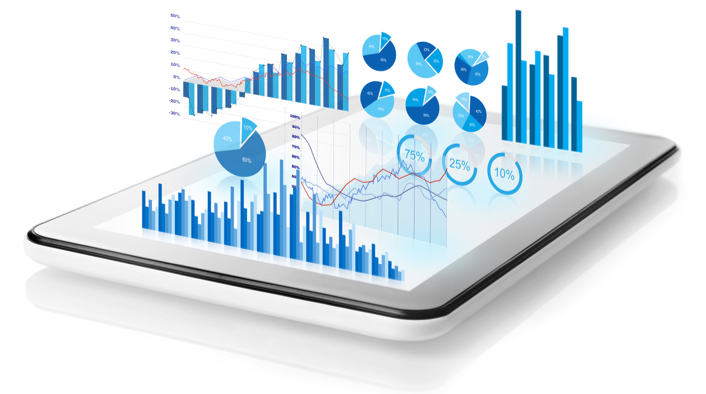
The University Technology Office (UTO) at ASU started publishing some key data points about the university's transition to a new teaching modality from day one.1 Our goal was to be transparent about the work that was being done to support students and faculty. As a director in ASU's Data Intelligence group, I'm fortunate to work with teams that deal with data from the university's administrative systems, learning tools, student applications, and many other sources. Given that the university was venturing to scale synchronous teaching in an uncharted way, the data intelligence team felt we could add a touch of clarity to the unknown by providing supporting metrics and data.
The Alternative Modality Key Data (alt-modality) [https://uto.asu.edu/alt-modality-key-data] page is fairly simple. We're not trying to wow audiences with maps, dials, and lights. We just want to present some key numbers that let our constituents know that we're keeping an eye on things. We also make much of the presented data simple to make the page as accessible as possible. While some of the data are simply descriptive, the data also reveal some wonderful stories:
- Technology distributed: This section of metrics doesn't even begin to do justice to the herculean effort our teams expended during the transition to synchronous teaching and learning. We had a bucket brigade of staff who were unboxing, imaging, and testing hundreds of laptops for distribution to students who needed them for synchronous learning. I'm proud to call these folks my coworkers.
- Call center: The Experience Center is the students' direct line to ASU for assistance. The call center team does a phenomenal job of supporting students on a week-to-week basis, but they have become a lifeline over the last few weeks. The data do a good job of showing the raw call volume related to the transition to synchronous learning.
- Canvas activity: With the move to synchronous teaching, the ASU LMS has become more vital than it already was. We have already seen about a 20 percent increase in the amount of time students are spending daily in Canvas. While that's neither a good nor a bad statistic, it validates that things have changed.
- Zoom sessions: Zoom is arguably the single most focused on piece of software (for positive reasons and for some not so positive ones). We felt it was incumbent upon us to track Zoom usage. With the confluence of remote teaching and remote working, ASU went from a peak of 1,500 daily sessions before the transition to synchronous teaching to a peak of more than 13,000 sessions since the transition.
Producing the alt modality page has been educational and is a great example of teamwork. From a CIO who asked for key data points to developers who extracted the data from source systems and data analysts who put the visualizations together, everyone pitched in over the couple of (weekend) days leading up to the transition.
Takeaways for Higher Education
While these specific metrics may not have much meaning for practitioners at other universities, this exercise illustrates the benefits that data-conscious institutions might gain through a similar effort. Being data-conscious is finding the middle ground between "we are data-driven, and students can be boiled down to a number" and "I've been doing this for twenty-five years. I don't need any data." We didn't know what we might do with Zoom data, but we knew collecting these data would be in our best interest. We have built the habit of asking about the data before we need the data. Implementing a new vendor tool? Make sure you know what data you can get from it. Developing a new app in-house? Have the development team instrument it with activity data. This practice is an investment that will pay for itself tenfold over time.
How Becoming More Data-Conscious Has Impacted ASU
I've been active in the higher education data and analytics community for twenty years, and I'm a big believer in the idea that data can be used to help support students throughout their academic journey. There's no silver bullet—everything we do with data is incremental. If we can use data to make a small, positive impact on a student's journey, then we're doing our job well.
The data and metrics that have been generated throughout the first few weeks of the pandemic are no different. They're not revolutionary, but they do two things. First, they demonstrate the university's transparency to its students and the greater ASU community. That's important for institutional credibility in these times when data, privacy, and student agency are such important topics. Second, they allow data practitioners in the UTO to contribute to the ASU charter: "ASU is a comprehensive public research university, measured not by whom it excludes, but by whom it includes and how they succeed. . . ."
For more insights about advancing teaching and learning through IT innovation, please visit the EDUCAUSE Review Transforming Higher Ed blog as well as the EDUCAUSE Learning Initiative and Student Success web pages.
The Transforming Higher Ed blog editors welcome submissions. Please contact us at [email protected].
Note
- "Alternative Modality Key Data" [https://uto.asu.edu/alt-modality-key-data], University Technology Office, Arizona State University, accessed June 1, 2020. ↩
Mike Sharkey is Data Intelligence Director at Arizona State University.
© 2020 Mike Sharkey. The text of this work is licensed under a Creative Commons BY-NC-ND 4.0 International License.