
Providing students with visualizations of learning data offers actionable information to support learning.
College students increasingly use online tools and services to interact with coursework, instructors, and classmates. They contend with variations in course design in the learning management system (LMS), track deadlines across multiple classes, and manage coursework—and that's all without taking into consideration the balancing acts they perform while juggling their schooling with work, family, social, health, and other aspects of their lives. The shift to online learning for so many students over the past year and a half has highlighted the importance of increasing students' self-motivation and self-reflection, helping them manage their learning. One type of tool that offers promise in this effort is student dashboards.
Student-facing learning analytics dashboards aim to improve learning by presenting students with actionable information grounded in how they (and their peers) engage with a course. These dashboards are becoming increasingly available and, in fact, are standard in some LMSs such as Blackboard and Moodle. However, their development has outpaced our understanding of effective design and how these tools do-or do not-support learning.
With that in mind, faculty researchers from University of Michigan's School of Information and School of Education partnered with the Teaching & Learning team in Information and Technology Services to develop a learning analytics dashboard for students based on research-informed design and with the intention to learn more about the efficacy of such a dashboard in student learning. The design approach was based on principles from learning theory, human–computer interaction, and information visualization. In addition to incorporating student voices in the design phases, the team surveyed students and studied usage patterns when the dashboard was rolled out on campus.
The result was My Learning Analytics (MyLA), a student-facing dashboard designed to support adaptive motivation and self-regulated learning, which is critically related to academic performance. MyLA provides students with information about their engagement with course materials, assignments, and grades, and it supports learning by delivering actionable information. Specifically, the dashboard strengthens awareness, self-reflection, and sense-making by providing a tool for students to monitor their course performance and progress toward their learning goals. The MyLA dashboard consists of data visualizations designed to reveal behavioral patterns associated with good learning skills; to guide decisions about actions students can take that may improve their academic outcomes; and to provide a transparent view of a student's course standing.
MyLA was developed as open-source software at the University of Michigan (U-M), with collaboration from developers at the University of British Columbia. MyLA draws on learner activity data that is stored in the Unizin Data Platform (UDP). Using the Caliper standard for learning events, UDP allows MyLA to include events from Canvas as well as other tools, such as Kaltura video. MyLA is also available as hosted software through the Unizin Consortium. Initially piloted in fall 2018 in three classes at U-M, MyLA has since been used in more than ninety courses at U-M, with over 7,200 students having access to it, some of them having access in three or more courses. The MyLA software is also in use or being piloted at six other Unizin institutions and at least one non-Unizin institution.
Design and Development
Over the past fifteen years, U-M has amassed huge amounts of data related to online learning and used that data for research and administrative purposes. Building on this work, the MyLA team recognized the need for a set of data visualizations that would help students understand and improve their own learning behaviors. The team's meta-review of similar efforts across higher education found that most were missing critical elements, including an underlying learning theory, rigorous usability testing, examination of effects of use on outcomes, and attention to the effects of performance comparison. Most also applied a "one size fits all" design and were not designed to scale.
To keep the MyLA project grounded in research and leverage analytics infrastructure already in place, the team established the following goals:
- Develop learning analytics visualizations for students
- Focus on providing information that promotes metacognitive skills
- Help students reflect on what they are currently doing
- Help students plan and modify behaviors to improve learning outcomes
- Build an application that leverages the UDP data
With a focus on supporting self-regulated learning for students, the MyLA team identified and applied six design guidelines:
- Support self-regulated learning and mastery orientation
- Allow students to control what they see
- Support social comparison
- Use a simple, consistent visualization/interaction vocabulary
- Preserve students' privacy
- Integrate Canvas and UDP for scalability and adoption
Three Views of Learning Behavior
Through multiple and ongoing iterations, the team designed three views aimed at helping students identify course materials they might have missed, plan their efforts for upcoming assignments, and understand their course performance relative to that of classmates, while preserving students' privacy. With each iteration, the team strove to provide actionable information that would help students reflect on their learning and plan their next steps. At the same time, the design team also worked to ensure that instructors would not be required to change their pedagogy or course design in order to use the MyLA dashboard in their classes.
Resources Accessed
On the Resources Accessed view, students can see which files, videos, and other resources in the course are accessed most often by classmates (see figure 1). The goal of the view is to help students plan their use of class resources by allowing them to see which resources other students are using that they might have overlooked. Resources are color-coded: blue if the student has accessed them and gray if not. File names are active links, enabling students to immediately open resources they haven't yet reviewed.
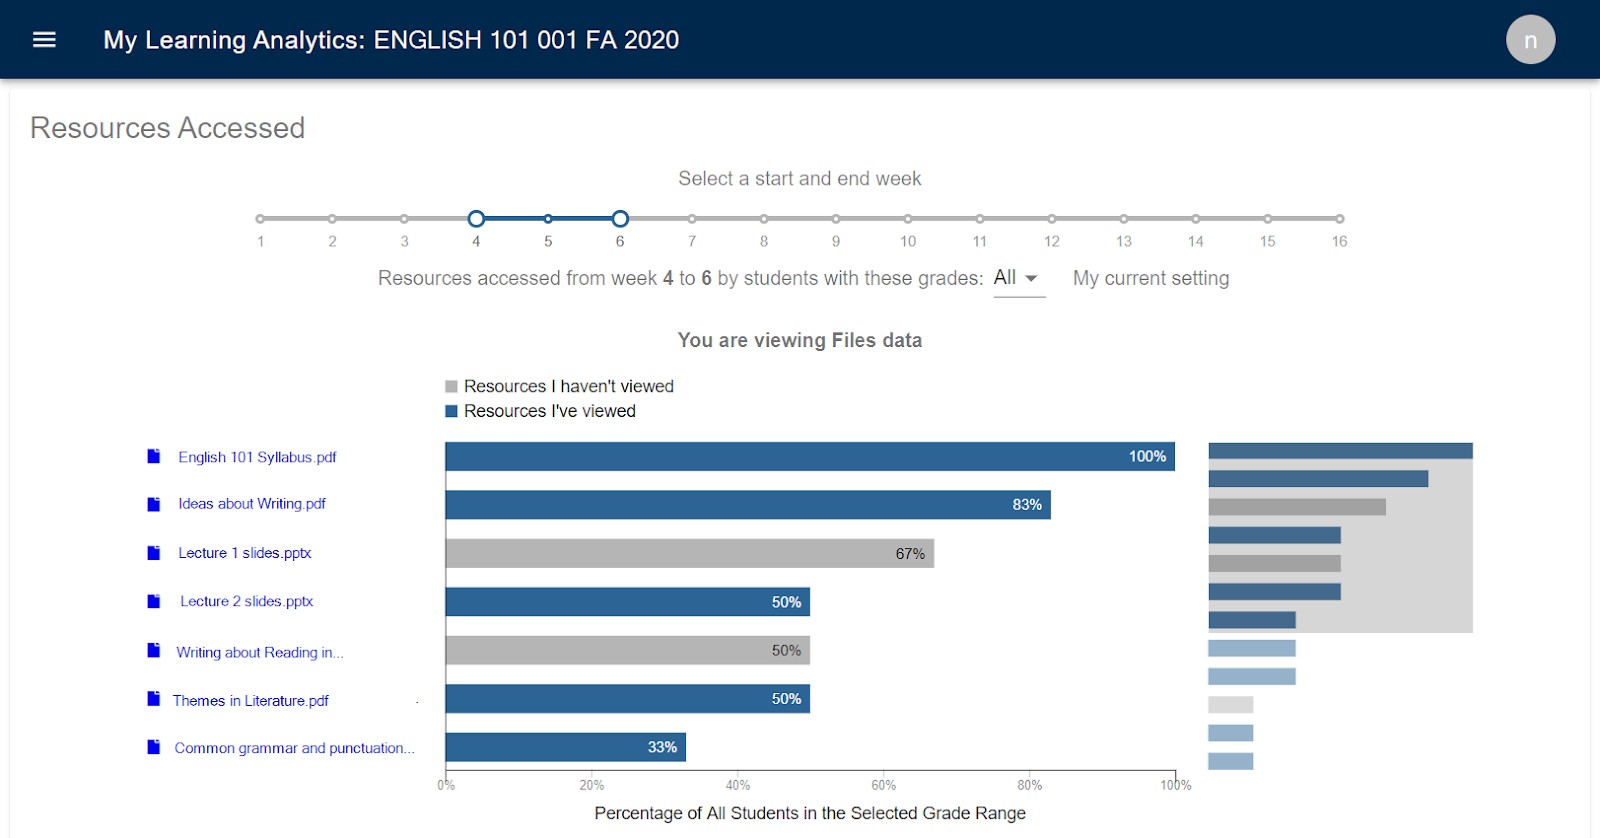
This was super helpful when it came to exam times. I could see how my classmates were studying and what resources they were using, and that helped me try to figure out my own game plan.
Students can also customize their view in several ways to explore the resources of interest to them. By using the time slider at the top, students can select specific weeks, such as the weeks prior to a midterm to prepare for an exam. They can also filter for specific types of resources, such as files or videos. Finally, they can filter to see which resources were popular with particular groups of students (e.g., students with grades between 90% and 100%, 80% and 89%, or 70% and 79%) to calibrate their own performance. They can also see more or fewer resources using a brush slider at the side.
Assignment Planning
With the Assignment Planning view, students can use the progress bar to see their current score and whether they are meeting learning goals (see figure 2). They can also see upcoming assignments and assignment weights to plan their studying. The list of assignments shows students how much each impacts the calculation of their overall course score, as well as their individual scores and average class scores for graded assignments. Students can also see which assignments are upcoming and which have been submitted.
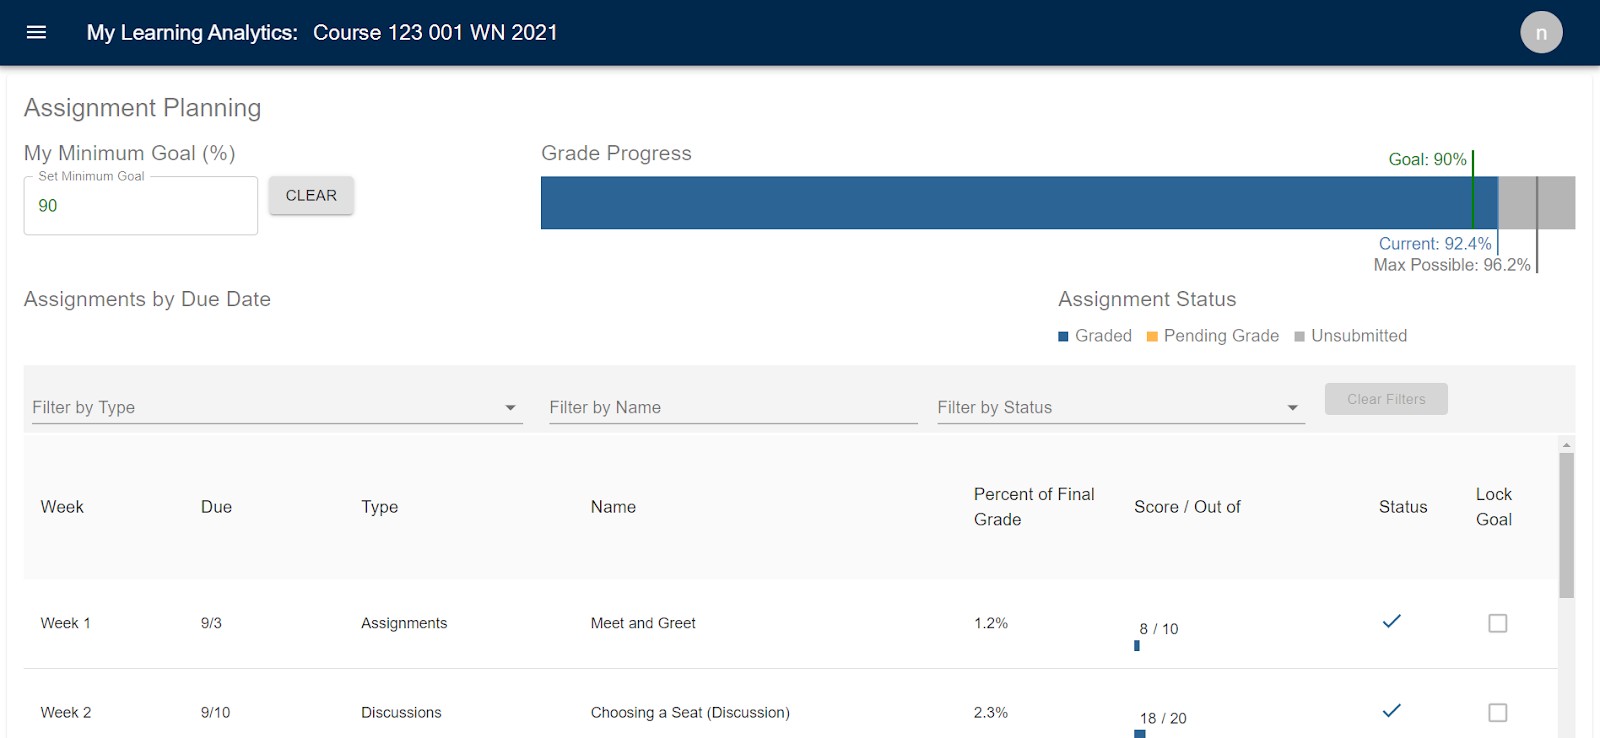
As with the other views, Assignment Planning provides agency for students in using the view. They have the option to set an overall course goal—as well as individual assignment goals—as they are planning their work. They can then revise and update the goals throughout the term. They can also filter the view to show assignments by type, name, or status, which can be helpful for courses with a lot of assignments.
It really helped plan out my studying goals—I knew how much each assignment counted for in my grade, so I could set priorities.
Grade Distribution
The most popular view with students, the Grade Distribution view, lets students monitor their performance in the class relative to the performance of their classmates (see figure 3). The view includes a histogram of the student scores in the course, as well as the average and median class grades and the class size. Based on student feedback, the U-M design team added the option for students to view their grade on the class distribution or hide that data.
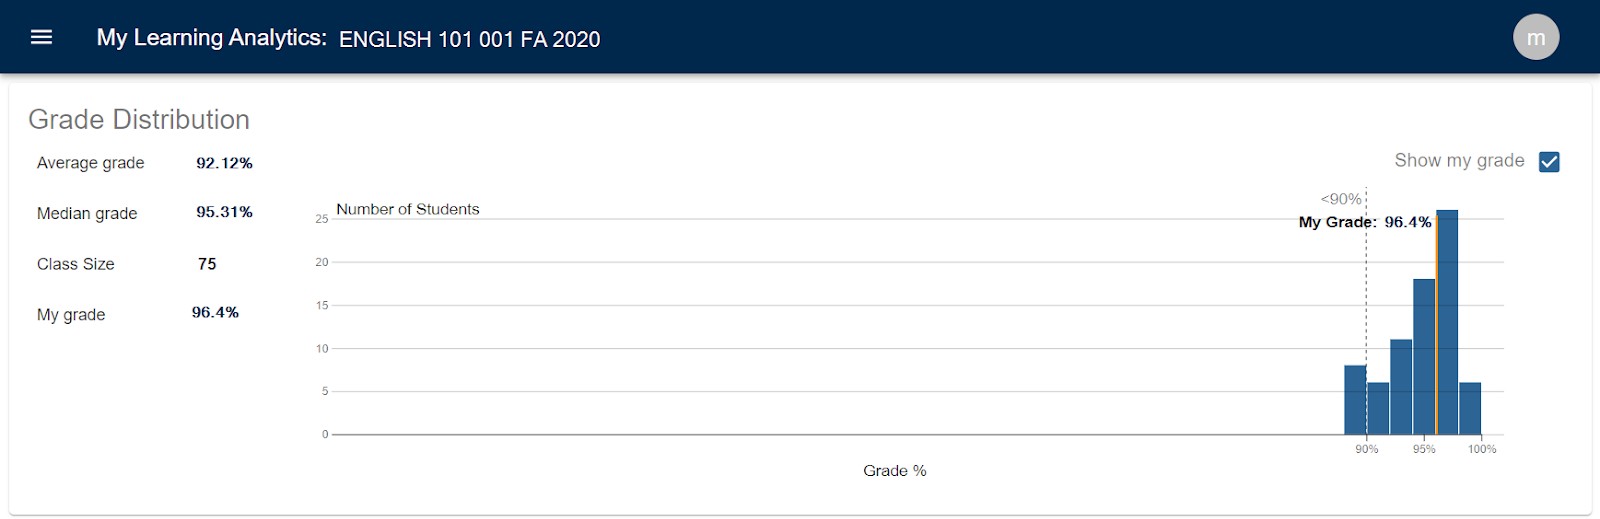
Privacy concerns were particularly important for this view. While the histogram avoids the problem of displaying classmates' scores on the chart, the team took care to protect the privacy of low-scoring students by adopting a k-anonymity approach to binning the lowest scores together and not displaying explicitly where they fall on the axis.
I thought it was useful to gain insight into how I was doing overall in comparison to other students in the class.
Student Usage and Feedback
Led by Stephanie Teasley of the University of Michigan School of Information, MyLA has an active research agenda, centered around student development of self-regulated learning skills. Researchers have reviewed the voluntary use of MyLA in sixty-one U-M courses from fall 2018 through fall 2020. Overall, student response to MyLA has been positive in terms of finding it useful without being difficult to use or significantly increasing student anxiety:
- Two-thirds (66%) of students reported changes in (1) how they studied, (2) their confidence that they understood the course material, and (3) the way they planned their course activity.
- Many students (43%) did not report experiencing increased anxiety as a result of viewing MyLA. Of those who did, most reported "slight" or "somewhat increased" anxiety.
- Most students (77%) reported being happy ("slightly" to "very") as a result of viewing MyLA.
- Less than 5% of the dashboard users reported difficulty using any of the three views.
- A wide majority (87%) of student users accessed the Grade Distribution view, followed by the Resources Accessed and Assignment Planning views.
- Almost all student users (92%) said they would like the dashboard to be available in all of their courses.
Additionally, feedback from student interviews and surveys has provided the MyLA team with suggestions for improvements in the visualizations. The team continues to research usage of MyLA and solicit feedback from students, especially as additional institutions begin to make MyLA available.
Looking Ahead
With the abrupt shift to online learning during the COVID-19 pandemic, increasing student motivation and supporting their learning strategies have been important scaffolds for students struggling to adapt to fully remote instruction. MyLA provided instructors and students at U-M with an additional tool to support that effort. As use increases and students come to expect dashboards to help them track their progress and plan their coursework, MyLA offers promise as a tool to support learning through self-reflection and planning and perhaps to increase student literacy in data analytics along the way.
Jennifer Love is Senior Business Systems Analyst, Teaching & Learning, Information and Technology Services, at the University of Michigan.
Sean DeMonner is Executive Director, Teaching & Learning, Information and Technology Services, at the University of Michigan.
Stephanie D. Teasley is Research Professor, School of Information, at the University of Michigan.
© 2021 Jennifer Love, Sean DeMonner, and Stephanie D. Teasley. The text of this work is licensed under a Creative Commons BY 4.0 International License.