
Key Takeaways
-
This case study of Indiana University's e-text initiative reports on students' actual use of and engagement with digital textbooks.
-
In a typical semester, students read more in the first four weeks and less in later weeks except during major assessment times; in a typical week, most reading occurs between 5:00 p.m. and 2:00 a.m. from Monday to Thursday, indicating that students use e-texts mainly as a self-study resource.
-
Highlighting was the markup feature most used by students, whereas use of the other interactive markup features (shared notes, questions, and answers) was minimal, perhaps because of students' lack of awareness of these features.
-
Research found that higher engagement with e-texts (reading and highlighting) correlated with higher course grades.
Although cost savings is often cited as a key advantage of electronic textbooks (aka, e-textbooks or simply e-texts), e-texts also provide powerful markup and interaction tools. For these tools to improve student learning, however, their adoption is critically important.1 This article focuses on the adoption and use of these tools and actual student reading data, which we consider understudied.2 Examination of actual reading data as well as markup use might help identify effective study practices that improve learning. In addition, adoption and use data might provide better measures to test the effectiveness of interactive e-texts as learning support tools. For example, previous research found that use of bookmarking, total number of pages read, and total number of days spent reading predict final course grade.3
Indiana University, as one of the few higher education institutions in the United States with a university-wide e-textbook adoption initiative, has also been studying adoption and use of e-textbooks by instructors and students.4 In our previous EDUCAUSE Review article5 we presented IU's e-texts program based on pilot data and some insights from faculty use of e-texts. In this article, we present findings based on actual use data on the e-text reading platform by IU students and instructors over multiple semesters.
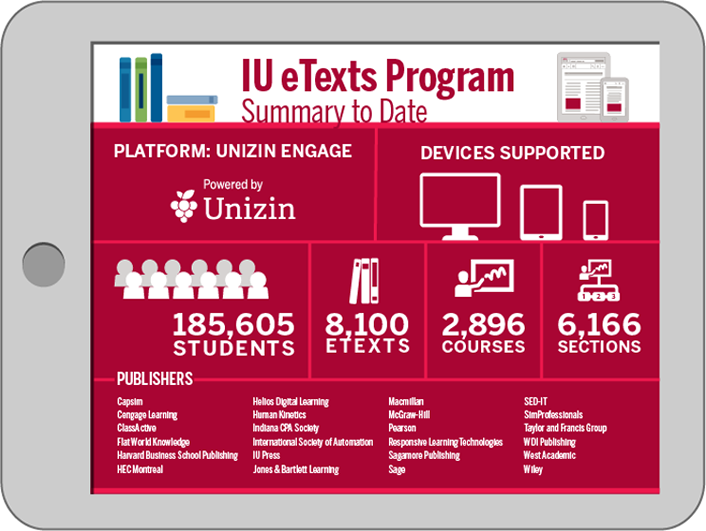
The Indiana University e-texts program, which began in 2009, has four primary goals:
- Drive down the cost of materials for students
- Provide high-quality materials of choice
- Enable new tools for teaching and learning
- Shape the terms of sustainable models that work for students, faculty, and authors
These goals have served us well. The program has continued to grow every year, and we now have agreements with more than 25 publishers at substantially discounted prices. As shown in table 1, the numbers — across calendar years from 2012 (when the program went into production) through 2016 — show strong growth. Now that we are more than five years into the full implementation of the e-text program, we are in a position to assess the progress we have made in addressing key concerns raised by instructors and students regarding e-text adoption.
Table 1. E-text adoption at Indiana University (2012–2016)
|
|
2012 |
2013 |
2014 |
2015 |
2016 |
|---|---|---|---|---|---|
|
Course Sections |
328 |
679 |
1,166 |
1,714 |
2,279 |
|
Adoptions* |
690 |
1,167 |
1,751 |
1,912 |
2,590 |
|
Students |
12,251 |
24,290 |
32,923 |
48,814 |
67,327 |
*"Adoptions" refers to a single course item (e.g., digital book, and a section may have one or more).
Costs
As noted, our agreements with publishers provide substantial cost savings for students. The formal calculation of the savings is the actual difference between the "print list price" and the negotiated IU e-text price for the publisher content. To date, student savings on textbooks amount to $21,673,338. However, we recognize that many students do not pay the full list price for paper textbooks when they purchase online, buy used copies, or recoup some of their costs when they resell their texts after the semester is over. In fact, an article from the New York Times highlights that actual student spending on course materials, including textbooks, was about half the actual cost of the textbooks and related course materials.6 Therefore, we divide the calculated savings by two and report that total as a more accurate representation of student savings. Consequently, we claim that students have saved about $11 million since IU's e-texts program started in spring 2012.
Printing
IU's e-texts program allows unlimited printing of textbook pages — up to 50 pages at a time, using the university's reading platform (Unizin Engage). According to page view records between the spring 2012 and spring 2016 semesters, 3,224 students from 251 courses (745 separate sections) printed over 130,000 pages of e-text (excluding multiple prints of the same page). In comparison, records show over 11 million distinct page view over the same time period. Therefore, paper-based reading constitutes only one percent of the total reading activity at IU. By comparison, there were 56,824 unique students in the system during this period. Thus, only five percent of the students chose to print from their e-texts.
In addition to printing through the e-text platform, students can purchase a print-on-demand (PoD) copy of an e-text for an additional fee. From fall 2012 until the end of spring 2016, our records show that 461 different students submitted 510 separate PoD requests, which varied from selected chapters of a book to a single complete book to multiple books or reading packages in one request. Some students requested paper copies more than once or requested multiple books at once, clearly having a strong preference for paper copies. Nevertheless, these students represent less than one percent of the total number of unique students (n = 52,763) active on the Engage platform during the same time period.
Limited Access
One downside of e-texts is that students lease their textbook for a limited time instead of owning it. This lease generally lasts a semester or six months, and students lose their access afterwards. However, with IU's e-text model, students get access to the textbook before the first day of class and maintain their access until they graduate from Indiana University. That is, students can go back to the e-texts after their course to review or reference the content in the book. This could be especially important if the e-text course is a prerequisite for another course.
Between spring 2012 and spring 2016, page view records show that a total of 7,167 distinct students viewed 312,119 pages of their textbooks after their courses finished. This corresponds to 13 percent of distinct students for all semesters combined, while it makes up only 1.6 percent of the total page views. Of the post-term reading, 60 percent occurred in the two weeks following the official last day of the semester, whereas the remaining 40 percent happened after the two-week period, even into the next semester or later. Overall, summer semesters have a higher volume of post-term reading (summer 2014 had the highest at 43,615 page views) than spring or fall semesters, even though fewer e-text course sections are held and fewer students attend summer semesters. Most of these post-term readings (95 percent) were affiliated with 100-, 200-, and 300-level courses as opposed to 400-level undergraduate courses.
Access on Multiple Devices and Offline Reading
With the browser-based e-text reading platform, students can access their e-texts from any device — desktop computer, laptop, tablet, or smartphone. In addition, students can choose to download an e-text to their devices for offline reading, which keeps the local copy on the device for two weeks and then syncs reading activity to their records when they go back online. Although the Engage database does not track the type of device used, it marks pages as having been accessed offline when synced.
Between the spring 2012 and spring 2016 semesters, a total of 4,343 distinct students accessed about 37,000 pages, which makes up less than 0.2 percent of the total page views in this time span. We conclude that offline reading features are barely used by students. Such a low volume of offline reading could result partially from a lack of awareness of this feature, as student responses to a recent survey revealed (discussed later).
Student Use of the E-Text Platform
The e-texts program at Indiana University has been available to all courses — online and traditional, undergraduate and graduate — during all semesters. Because student profiles and studying habits differ between graduate and undergraduate courses (not to mention between online and traditional courses), we have limited our following report to undergraduate courses offered in face-to-face settings in fall and spring semesters only. We also excluded data from spring and fall 2012 semesters, as the first two semesters of the program's implementation do not reflect the full-adoption patterns. As a result, the sections below present data between the spring 2013 and spring 2016 semesters, broken down by distinct courses, sections, e-text titles, and students (table 2).
Table 2. Data demographics (distinct counts) from Engage
|
Semester |
Courses |
Sections |
E-text Titles |
Students |
|---|---|---|---|---|
|
Spring '13 |
82 |
176 |
136 |
6,213 |
|
Fall '13 |
105 |
292 |
127 |
9,387 |
|
Spring '14 |
131 |
309 |
169 |
9,494 |
|
Fall '14 |
120 |
398 |
149 |
11,102 |
|
Spring '15 |
136 |
330 |
154 |
9,304 |
|
Fall '15 |
134 |
361 |
285 |
11,217 |
|
Spring '16 |
157 |
376 |
181 |
11,394 |
How Much and When Do Students Read Their E-Texts?
Answering this question depends on page views. The Engage database records a page view when a user stays on an e-text page for at least 10 seconds. This threshold aims to differentiate between browsing and reading activity, according to the Engage developers. Viewing a page for at least 10 seconds serves as a proxy indicator for reading in the absence in the database of the variable "time spent on a page." With this assumption in mind, we use "reading" and "page view" interchangeably for the remainder of this article.
For all semesters combined, over 46,000 students viewed more than 15 million pages of e-texts in 2,242 distinct course sections. This total includes multiple viewings of a particular page for review and studying purposes. As described earlier, students could access their e-texts before the first day and after the last day of class. When we compare the page views before, during, and after the regular semesters, nearly all page views (98.6 percent) occurred during the regular semester. Even though only 0.4 percent of the total page view records occurred before classes started, on average 8 percent of the students in any semester opened or explored their e-text before the semester. Similarly, page views after the end of the semester constitute only one percent of the total page views, with about 10 percent of the students each semester re-visiting their textbook after their course finished.
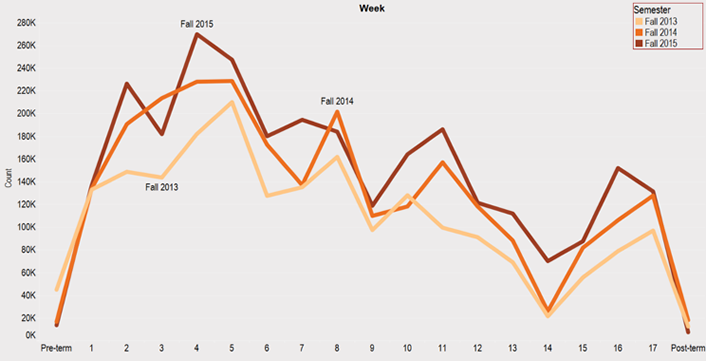
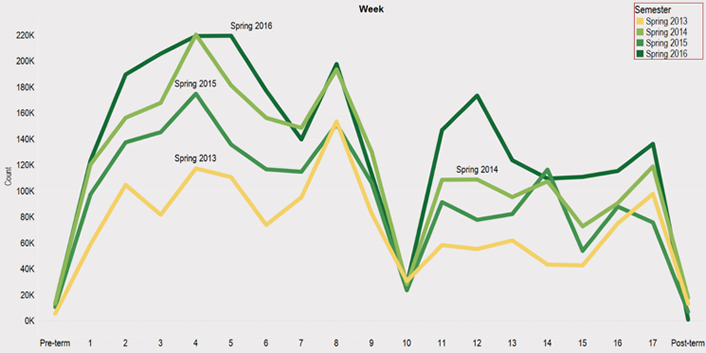
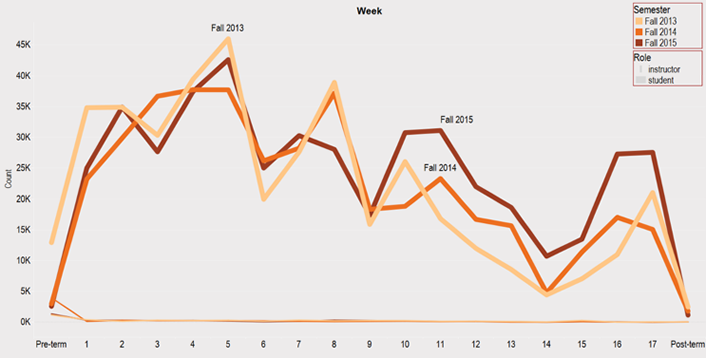
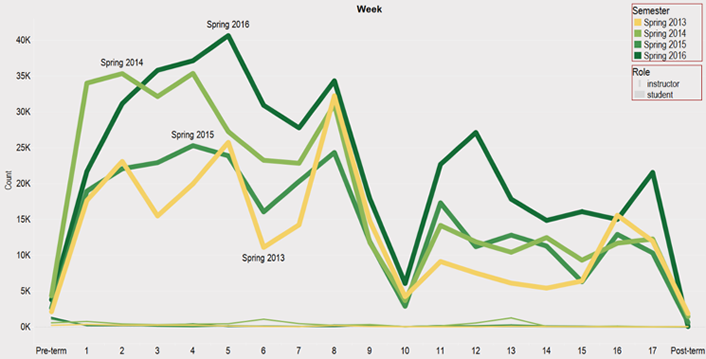
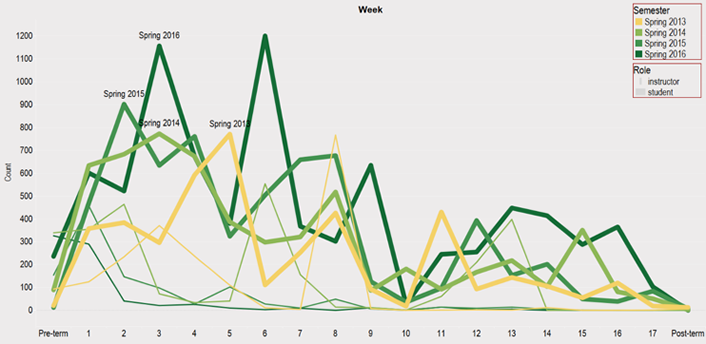
Reading Pattern per Semester
After the overall summary of page view records, we then examined weekly page views during each semester. As evidenced by figures 1 and 2, summarizing weekly activity for fall and spring semesters, respectively, the general reading activity for students closely followed the term schedule. Substantively more reading occurred within the first four weeks of a term, followed by a small decline before a slight increase. Since these data come from undergraduate courses, this pattern probably corresponds to assessment activities for courses. Drops in activity corresponding to semester breaks for the fall and spring terms (Thanksgiving and Spring Break, respectively) also support this pattern. Following these breaks, activity is somewhat reduced and likely follows concluding course assessments such as final exams. Lastly, the reading activity corresponds with the use of the interactive markup features, which suggests that most markup occurs during reading as opposed to reviewing.
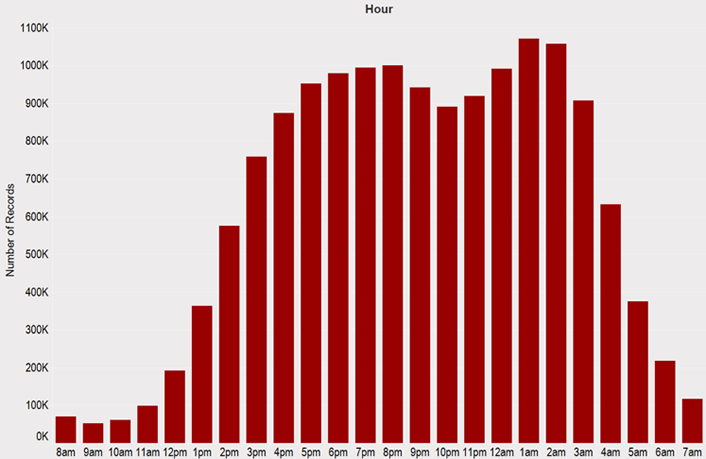
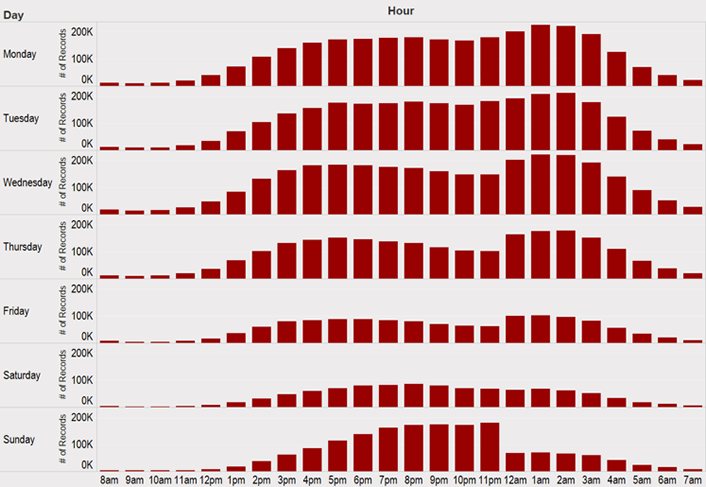
Time of Day
Using actual time stamps from the page view records, we examined the page views across all courses in fall and spring semesters by the hour of day (figure 3). In a 24-hour time window, students viewed 26 pages on average. Students' reading activity started slowly in the morning (3,404 students with 15 page views per student) and intensified through the afternoon into the evening and night. Although reading slowed down between 9 p.m. and midnight, it picked up after midnight and reached peak levels between 1–2 a.m. (30,604 students with 35 page views per student). The number of students studying dropped sharply after 3 a.m. until 7 a.m. in the morning. Given that most of the e-text courses in our sample were taught face-to-face during the day, the pattern in hourly page view activity indicates that students used their e-texts mostly for self-studying.
Examining hourly page views by day of the week also elicits interesting study patterns. As figure 4 demonstrates, students tend to follow the same studying routine Monday through Thursday, when most of their studying from textbooks occurs in the evening and late night. On Friday and Saturday, the volume of page views decreases sharply. On Sunday, students resume studying in the afternoon. Unlike other days when peak study times extend past midnight, the number of students studying after midnight on Sunday more than halves, resulting in a sharp drop in page views.
Use of Markup and Interactive Features
The e-text platform offers multiple markup features such as highlighting and taking notes. This also allows users to interact with each other in the form of shared highlights and notes, or by posing and answering questions. These features are intended to assist students and instructors in their educational practices.
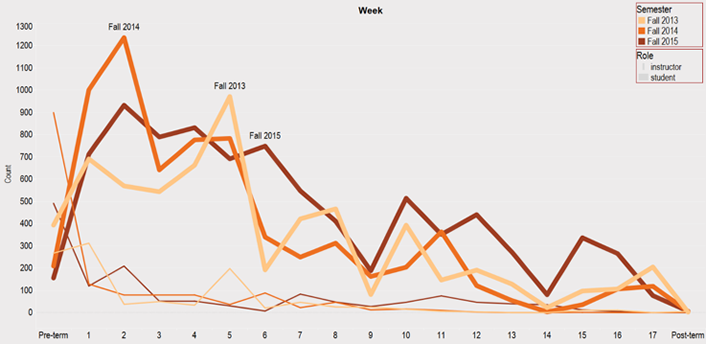
Highlights
Highlights are the most used markup feature at IU. As indicated in figures 5 and 6, highlights are largely student driven, though some instructors appear to have also used this feature to a substantively lesser extent. Across all terms, an average of 49 highlights per student and 35 highlights per instructor occurred within the selected semesters. The use of highlights roughly follows the pattern of reading activity across terms (see figures 1 and 2). That is, most of the activity occurred early within the term and fell off substantially in the later days of the term, although some variation appeared in the extent of decline from term to term. Instructors, however, tended to use highlights prior to or early in the semester.
Notes
Weekly use of the notes feature varied more than the other interactive markup features. As figures 7 and 8 show, total volume of notes use is significantly lower than use of highlights. Student use of the notes feature follows a similar pattern of activity with the other markup features. Much of the student activity occurred earlier in the term, though this varied somewhat within the spring semesters. Students' use of notes was more limited in comparison to highlight use. Across all terms and courses, users made an average of 13 notes per instructor and one note per student. Instructors used notes most after the highlights feature; instructor notes and highlights are automatically shared with students in Engage.
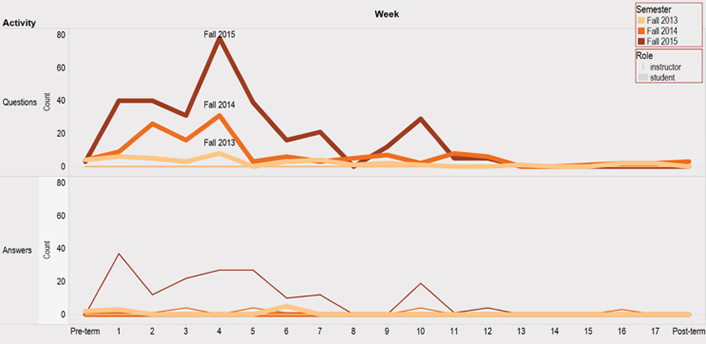
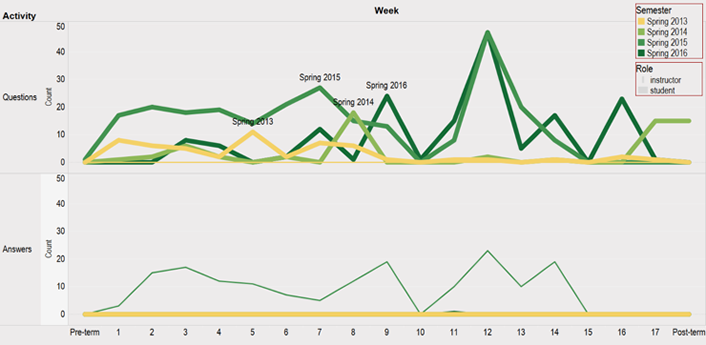
Questions and Answers
In Engage, students can add a note to highlighted text and then turn this note into a question for the course instructor to answer. The data from the database records indicate that student engagement with question and answer features was limited. Across all terms, student use of this feature occurred in only a few course sections. Although instructors can respond to student questions, most of the instructors have not used this feature. As can be seen from figures 9 and 10, instructor use of answers was primarily limited to the spring 2015 semester. This increased instructor use aligns with increased student use, which suggests that an instructor familiar with the platform might guide or encourage use of the question and answer feature.
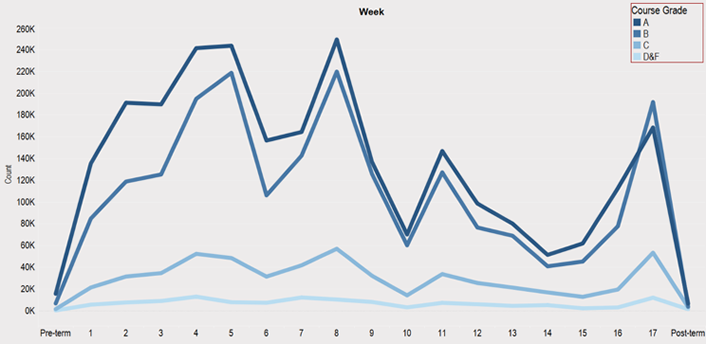
How Does E-Text Engagement Relate to Course Grades?
To answer this question, we used a large subset of IU Bloomington student grade data, combined with Engage records. As figures 11 and 12 indicate, high-achieving students (A and B grades) made the majority of page views and highlights. Average performing students (C grade) had substantively less page view and markup activity across all terms. Finally, students who had an unsuccessful outcome (D and F grades) had little to no activity in either accessing the e-text or using interactive markup features. In general, then, these data support the expected pattern of higher engagement with reading materials relating to higher performance within courses.
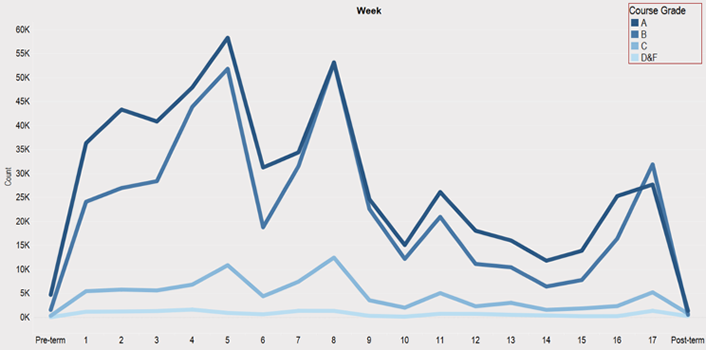
This pattern of higher engagement leading to higher performance (upon further analysis and statistical testing) might provide indicators for inferential and predictive work with e-reader data. When connected to additional data sources (e.g., learning management system and assessment data), e-reader activity data can be used to develop predictive and supportive models for assisting and improving student success within higher education — especially when a course is designed around taking advantage of such data.
Does Instructor Engagement with E-Text Drive Student Use of E-Texts?
Instructor use of the e-text platform and its interactive features has generally been limited, especially when compared to student activity within the platform. Even though students and instructors have different roles and responsibilities in a course, a desired outcome for e-text adoption would be corresponding use of the interactive features between instructors and students.
From descriptive statistical analyses, we determined that instructors primarily use the highlight and note features. With this in mind, we assessed instructor use of these features on a weekly basis by counting how many times these features were used within a semester. Since instructor activity occurs at various times, we divided course instructors into two groups: less than four weeks of interactive feature use and more than four weeks of interactive feature use. If a course had more than one instructor, we allowed inclusion in the higher activity use (≥ 4 weeks) group if at least one of the identified instructors had four or more weeks of activity. A sample of 10 course sections per group was taken from the total data set (n = 1,068 students). Table 3 provides summary statistics between the levels of student access of the text by instructor activity groups.
Table 3. Summary statistics by instructor markup activity
|
Measure |
Instructor Activity (≤4 weeks) |
Instructor Activity (>4 weeks) |
|---|---|---|
|
n |
537 |
531 |
|
Mean |
9.5% |
18.0% |
|
Median |
5.0% |
9.0% |
|
Std. Dev. |
12.5% |
22.5% |
To address the high degree of variation and skewed distributions of student page views, we selected the course section median of the percentages of student page views as the metric for determining an instructor's influence on class use of e-texts. An independent samples t-test of unequal variance indicated a slight, albeit not statistically significant, difference between the section median percentage of page views of the two groups (t = 1.77, df = 11, p = .051). This result calls for a more nuanced investigation into the course designs and contextual elements that guide use of Engage. As of this writing, we are in the process of conducting these more intensive inferential analyses.
Insights from the IU Learning Technologies Survey
In fall 2016, we conducted a university-wide Learning Technologies survey using a random sample of all students, faculty, and staff. The survey's purpose was to assess awareness and use of specific teaching, learning, and collaboration services/technologies provided by University Information Technology Services. Ten percent of the student sample from three different campus profiles (Bloomington, Indianapolis, and regional campuses) responded. The student survey included a section on e-text use, where students were asked if they used an e-text, whether they were aware of markup and interactive features, and what they liked most and least about e-texts.
Forty-eight percent of the students (n = 875/1,816) indicated that they took at least one course that used an e-text. As a follow-up question for students who had used e-texts before, we asked if they were aware of the interactive and markup features of the e-text platform. While 57 percent of respondents knew that they could take their own notes within the e-text platform, only 33 percent realized they could ask their instructors questions within the platform. In addition, 40 percent were aware they could read their e-text offline, even when not connected to the Internet. These numbers indicate room for improvement in terms of increasing awareness of the e-text platform features.
In the survey, we also asked students who have used an e-text to respond to two open-ended questions regarding what they liked most and least about their experiences. A total of 379 students commented on what they liked most; a total of 376 students commented on what they liked least. These comments were coded by two of the authors with 95 percent inter-rater reliability. Several themes emerged from the positive and negative comments (figure 13).
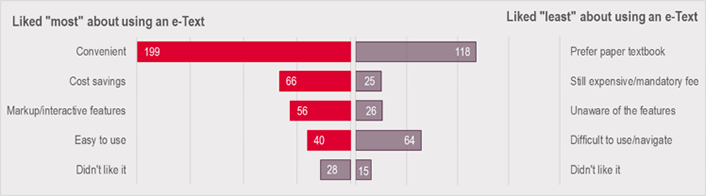
Nearly 200 students noted that they liked e-texts because of convenience, particularly not "having to lug around a physical textbook" and having an e-text "accessible at any time." In contrast, 118 students preferred physical books over digital books. These students noted that they still "like physical books" or "prefer to read on paper versus on screen for studying." As noted in the introduction, students have the option to request a paper-on-demand copy of their e-texts in IU's e-texts program.
Sixty-six students expressed that they were pleased with e-texts because the program helped them save on their college costs. Therefore, "low cost" and "affordability" of e-texts were appealing. On the other hand, 25 students argued that e-texts are still expensive, or they did not like having to pay a mandatory e-text fee once their instructor signed up for an e-text. Another comparable theme between likes and dislikes was the lack of understanding about markup and interactive features of the e-text platform. Fifty-six students praised the features as contributing to their positive experience. Comments referenced "ease of searching," "adding self-notes," and "important information is highlighted." By comparison, 26 students wrote negative comments such as "can't write in" or "can't add note or highlight," which indicated a lack of awareness of the markup and interactive features. Had they known about these features, they might have had a more positive experience.
In another theme, 40 students indicated they found the platform easy to use, while 64 students found it difficult to use or navigate, particularly when flipping back and forth through the pages of a book. Finally, a group of students (n = 43) explicitly stated that they did not like e-texts, without offering a reason for their dislike.
Implications
Our results point to a conclusion that educators and educational researchers have long known: More engagement with and accessing of course materials leads to more positive outcomes for students. Often unknown, however, are the types of access and resource use employed by students within specific educational contexts, especially when most of their activity occurs outside of formal educational spaces. E-text readers can provide possible insights into both the degree and kinds of engagement employed with course materials. On its own, this information is unlikely to yield effective and efficient analytic models of student engagement. However, when coupled with other data sources corresponding to learning activities and spaces (e.g., LMS activity), the development of predictive systems for course instructors and academic advisors becomes a real possibility.
An additional factor to consider in the adoption and implementation of e-text readers is the possibility of positively affecting students' reading practices and instructors' pedagogical practices. Engage offers instructors and students opportunities to collaboratively interact with the reading materials through the tool platform. However, as our data reveals, instructor use of the tool's interactive features was minimal for most cases. While the reasons likely vary between instructors and courses, these data indicate the need for additional training on the effective use of the platform. To address this need, we are currently creating a professional development module for instructors along with an online student orientation module about "learning with e-texts" that will be available in fall 2017. These modules will be guided by John Dunlosky et al.'s effective learning techniques.7 Instructor modules are self-paced online modules that will also be used for the "teaching with e-texts" workshops at the campus centers for teaching and learning across IU campuses. In addition, an online orientation module titled "learning with e-texts" targets students set to take a course with e-text. We hope that by gaining insights into the various features available within Engage, both instructors and students will increase their engagement with e-texts, thereby contributing to better student performance.
Notes
- Sam van Horne, Jae-eun Russell, and Kathy L. Schuh, "The Adoption of Mark-up Tools in an Interactive E-Textbook Reader," Educational Technology Research and Development, Vol. 64, No. 3 (2016): 407–433.
- Allan Dennis, Serdar Abaci, Anastasia Morrone, Joshua Plaskoff, and Kelly McNamara, "Effects of E-Textbook Instructor Annotations on Learner Performance," Journal of Computing in Higher Education, Vol. 28, No. 2 (2016): 221–35; van Horne, Russell, and Schuh, "The Adoption of Mark-up Tools in an Interactive E-Textbook Reader."
- Reynol Junco and Candrianna Clem, "Predicting Course Outcomes with Digital Textbook Usage Data," The Internet and Higher Education, Vol. 27 (2015): 54–63; van Horne, Russell, and Schuh, "The Adoption of Mark-up Tools in an Interactive E-Textbook Reader."
- Alan Dennis, "e-Textbooks at Indiana University: A summary of two years of research," 2011; Dennis, Abaci, Morrone, Plaskoff, and McNamara, "Effects of E-Textbook Instructor Annotations on Learner Performance."
- Serdar Abaci, Anastasia Morrone, and Allan Dennis, "Instructor engagement with E-Texts," EDUCAUSE Review, Vol. 34, No. 1 (2015).
- Ann Carrns, "A Quandary Over Textbooks: Whether to Buy or Rent," New York Times, August 8, 2014.
- John Dunlosky, Katherine A. Rawson, Elizabeth J. Marsh, Mitchell J. Nathan, and Daniel T. Willingham, "Improving students' learning with effective learning techniques: Promising directions from cognitive and educational psychology," Psychological Science in the Public Interest, Vol. 14, No. 1, (2013): 4–58.
Serdar Abaci, PhD, is an educational research and evaluation specialist in Learning Technologies, University Information Technology Services, Indiana University, Bloomington.
Joshua Quick is a learning data analyst in Learning Technologies, University Information Technology Services, Indiana University, Bloomington.
Anastasia S. Morrone, PhD, is associate vice president, Learning Technologies, Indiana University and dean for IT, IUPUI.
© 2017 Serdar Abaci, Joshua Quick, and Anastasia S. Morrone. The text of this article is licensed under Creative Commons BY 4.0.