
Key Takeaways
- MOOC critics are concerned about low overall completion rates, but these rates are typically evaluated without accounting for student intentions.
- This study, based on survey and log data from nine HarvardX courses, investigates how completion and attrition rates differ based on students' self-reported intentions about course participation.
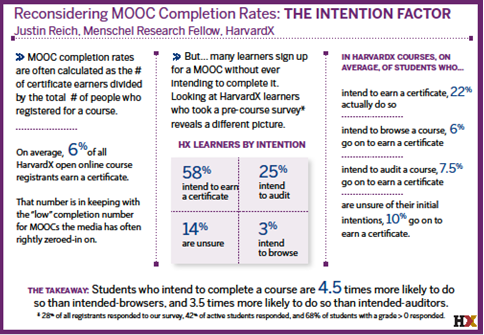
- The study found that, on average among survey respondents, 22 percent of students who intended to complete a course earned a certificate, compared with 6 percent of students who intended to browse a course.
- Efforts to personalize MOOCs based on self-reported intentions should be conducted with care: many students who do not intend to complete a MOOC do so, and most who do intend to complete a MOOC are not successful.
Justin Reich is Richard L. Menschel HarvardX Research Fellow, Harvard University.
The signature critique of massive open online courses (MOOCs) is that they have low certification rates.1 From the first mega-courses offered at Stanford and MIT, commentators have observed that a relatively low percentages of students who ever register for a course go on to earn a certificate. Across hundreds of MOOCs now completed, certification rates typically range from 2 to 10 percent when we divide the number of certificate earners by the total number of students who have ever registered for a course.
Some have responded to these concerns by arguing that this way of calculating MOOC certification rates is misleading because it does not account for student intention.2 Students register for MOOCs for many reasons, and many students have no intention of completing the courses in which they enroll. For most MOOCs, the only way to "shop" is to sign up, so many students who register do so only to evaluate the course. Others who register for a MOOC intend only to audit the course or complete a section of the course, so they register with an intent to participate and learn but not with an intent to complete.
As some have argued,3 if residential college course completion rates were calculated in the same manner as MOOC completion rates, we would have to divide the number of people who pass a residential course not by the number enrolled in the course at the add/drop deadline, but by the number of people who ever applied to enter the university. A better approach might be to calculate MOOC completion rates as a percentage of students who enrolled in a course with the intention to complete the course and earn a certificate.
HarvardX research into MOOC intention and completion
Toward a Measure of Intention
Daphne Koller and her colleagues were among the first to make this rebuttal in their EDUCAUSE Review Online article, "Intention and Retention in Massive Open Online Courses."4 In the article, Koller and colleagues investigated some of the underlying mechanisms of certification rates by examining attrition rates — that is, the rate at which students stop participating in a course.
The researchers examined MOOC attrition by analyzing the number of hours of lecture video watched by students in Coursera courses. They argued that the distribution of hours of video viewed in these courses could be modeled with a two-component mixture model, in which students are hypothesized to come from one of two groups: a high-retention or a low-retention group. In this model, each group is estimated to have a consistent attrition rate: a high attrition rate for the low-retention group and a low attrition rate for the high-retention group. These differences in attrition over time explain, by the course's end, the differences in certification rate.
Koller and colleagues then suggest that researchers and course developers might be able to identify whether MOOC registrants belong in the high-retention or low-retention group by asking them about their intentions. They shared limited early data that suggested that students who indicated an intent to complete a course did so at higher rates.
In one course, Writing in the Sciences, students were asked to complete a pre-course survey about their intended commitment to the course. Of those who completed the survey, 63 percent indicated that they intended to earn a certificate; of those students, 24 percent did so. Among all other students — those who did not complete the survey and those who submitted a survey but did not intend to complete the course — only 2 percent earned a certificate. The evidence to warrant this line of reasoning, however, was limited because student intentions were solicited from only a few courses. To better explore these issues, more systematic survey data were needed.
The HarvardX Survey
In the 2013–2014 academic year, my colleagues and I at HarvardX — an initiative at Harvard University to create online courses accessible to the public — instituted a common pre-course survey in our open online courses that probed students in four dimensions:
- Intention: how much of the course they intended to complete.
- Motivation: why they enrolled in the course.
- Preparedness: their familiarity with the course content and with online learning.
- Demographics: student backgrounds, including country of residence and parental education.
These data facilitated my detailed investigation of how attrition and completion in HarvardX open online courses differ by a student's stated intentions.
Two research questions guide my inquiry into completion, attrition, and intention:
- Across multiple courses, what are the completion rates of students who intend to complete a course compared with other students?
- What are patterns of attrition among students who intend to complete a course compared with other students?
Addressing the first question responds to those who have argued that analyses of MOOC completion rates must be conditioned on student intentions. Addressing the second question illuminates some of the underlying mechanisms that lead to differential completion rates. Answers to these questions also can help policymakers better understand the opportunities and challenges that open online courses pose for higher education and help course developers better understand how learners engage with these courses.
Survey and Log Data
To address these research questions, I draw on data from nine HarvardX courses, which had a total of 290,606 registrants and 79,525 survey responses.5 As table 1 shows, these courses ranged in size from 11,000 to 92,000 students. As previously reported,6 many course registrants never enter the courseware and only a small percentage engage with problems and assignments. Using an unweighted course average (ignoring the number of registrants in each course), 65 percent of students take at least one action within a course, 21 percent earn a grade greater than zero, and six percent earn a certificate.
Table 1. Descriptive statistics for the nine HarvardX courses
| Course | Launch | Wrap | Days | Enrollees | Actions > 0 | Grade > 0 | Earned Cert. |
|---|---|---|---|---|---|---|---|
| Ancient Greek Hero | 9/3/13 | 12/31/13 | 119 | 17,915 | 14,420 | 2,638 | 730 |
| Science and Cooking | 10/8/13 | 3/15/14 | 158 | 92,045 | 60,924 | 10,280 | 1,795 |
| Clinical Trials | 10/14/13 | 2/14/14 | 123 | 28,102 | 18,400 | 6,440 | 2,408 |
| China: Part I | 10/31/13 | 12/23/13 | 53 | 37,238 | 20,067 | 8,276 | 2,022 |
| Health and Society | 11/15/13 | 2/14/14 | 91 | 34,775 | 19,947 | 9,190 | 3,321 |
| Letters of Paul | 1/6/14 | 3/5/14 | 58 | 32,663 | 22,166 | 5,295 | 1,547 |
| Global Health | 2/25/14 | 5/27/14 | 91 | 11,514 | 8,335 | 3,227 | 1,266 |
| Data Analysis in Genomics | 4/7/14 | 6/30/14 | 84 | 20,315 | 13,114 | 4,747 | 653 |
| U.S. Health Policy | 4/7/14 | 6/30/14 | 84 | 16,069 | 8,893 | 3,054 | 761 |
| | |||||||
| All HarvardX Students |
|
|
| 290,606 | 18,6266 | 53,147 | 14,503 |
| Nine Course Average |
|
| 96 | 32,293 | 20,623 | 5,905 | 1,611 |
When each course launched, students were directed to a pre-course survey in the courseware. Reminder e-mails were sent to students who did not complete the pre-course survey. When examining survey data, it is important to examine what proportion of a target population responds to a given survey. As expected, response rates to the pre-course survey were higher among a course's more active students. On average across the courses, 27 percent of all registrants, 42 percent of students with at least one action, and 68 percent of students with a non-zero grade completed the survey. Findings from the survey data analyses generalize best to students who complete at least one action in the course or earn a non-zero grade.
Measures
My analysis here includes three kinds of measures:
- self-reported intentions,
- student demographic characteristics, and
- persistence and course completion computed from course event logs.
To ascertain student intentions, the HarvardX pre-course survey asked the following question: "People register for HarvardX courses for different reasons. Which of the following best describes you?"
- Here to browse the materials, but not planning on completing any course activities. [coded as Browse]
- Planning on completing some course activities, but not planning on earning a certificate. [coded as Audit]
- Planning on completing enough course activities to earn a certificate. [coded as Complete]
- Have not decided whether I will complete any course activities. [coded as Unsure]
Table 2 shows the distribution of these intentions by course, ordered by the percentage of students intending to complete the course. The percentage of students stating that they intended to earn a certificate in each course ranges from 40 percent in U.S. Health Policy course to 78 percent in Clinical Trials.
Table 2. Distribution of students' self-reported course engagement intentions in nine 2013–2014 HarvardX courses
|
| Unsure | Browse | Audit | Complete | Total Responses | Response Rate |
|---|---|---|---|---|---|---|
| Data Analysis in Genomics | 13 | 5 | 42 | 40 | 5,657 | 28 |
| U.S. Health Policy | 12 | 5 | 37 | 46 | 3,845 | 24 |
| Science and Cooking | 17 | 3 | 30 | 49 | 27,610 | 30 |
| China: Part I | 17 | 5 | 27 | 51 | 7,901 | 21 |
| Letters of Paul | 14 | 2 | 30 | 53 | 8,563 | 26 |
| Ancient Greek Hero | 18 | 4 | 21 | 57 | 7,577 | 42 |
| Global Health | 11 | 2 | 18 | 69 | 3,966 | 34 |
| Health and Society | 11 | 2 | 12 | 75 | 5,514 | 16 |
| Clinical Trials | 9 | 2 | 10 | 78 | 8,892 | 32 |
| | ||||||
| All Students | 15 | 3 | 26 | 56 | 79,525 | 27 |
| Course Average | 14 | 3 | 25 | 58 |
| 28 |
HarvardX collected demographic data from two sources. All students who register for the edX site are asked questions about their year of birth, gender, and their education level (converted here to an eight-point scale ranging from none to doctorate). The HarvardX pre-course survey asked additional questions about students' country of residence, English fluency (on a scale from 1 to 5), and course topic familiarity (on a scale from 1 to 5). These additional demographic questions were assigned to a random half of survey takers; although there are fewer responses to these questions, the responses generalize to both random halves.
Finally, students who earn a course's minimum passing grade can earn a certificate of completion. I describe those who do not earn a certificate as "stopping out" of the course. The neologism is unusual, but if a student never intended to complete an entire course, the phrase "dropping out" has an inappropriately pejorative connotation.
To measure student persistence, I use event logs to determine a student's first and last dates of activity in a course. For all students who do not earn a certificate, I define their last date of activity as their stop-out date. Accordingly, students who earn a certificate never stop out of a class, regardless of when they finish their activity.
Intention and Completion
In the nine HarvardX courses, certificate rates — that is, the percentage of all registrants who earned a certificate — ranged from 2 to 11 percent, aligning with common findings from all MOOCs. Table 3 shows the completion rates for different subpopulations within each course.
Table 3. Certification rates of students with various intentions from nine 2013–2014 HarvardX courses
|
| All | Respondents | Unsure | Browse | Audit | Complete |
|---|---|---|---|---|---|---|
| Data Analysis in Genomics | 3.2 | 8.9 | 5.8 | 3.3 | 5.1 | 14.6 |
| U.S. Health Policy | 4.7 | 15.8 | 9.5 | 5.5 | 8.8 | 24.1 |
| Science & Cooking | 2.0 | 5.7 | 2.7 | 0.7 | 1.5 | 9.8 |
| China: Part I | 5.4 | 19.4 | 12.4 | 3.6 | 9.0 | 28.8 |
| Letters of Paul | 4.7 | 13.7 | 7.5 | 6.6 | 5.5 | 20.3 |
| Ancient Greek Hero | 4.1 | 6.8 | 4.2 | 1.7 | 3.5 | 9.1 |
| Global Health | 11.0 | 25.8 | 14.1 | 8.3 | 10.8 | 32.2 |
| Health and Society | 9.6 | 31.2 | 21.3 | 14.3 | 15.5 | 35.7 |
| Clinical Trials | 8.6 | 21.4 | 10.6 | 9.0 | 8.0 | 24.8 |
| | ||||||
| All Students | 5.0 | 13.3 | 6.9 | 3.7 | 4.9 | 19.5 |
| Course Average | 5.9 | 16.5 | 9.8 | 5.9 | 7.5 | 22.1 |
Among all students, certification rates ranged from 2.0 to 11.2 percent, with an average across courses of 5.9 percent. The certification rates of survey respondents are much higher than the certification rate of all students, ranging from 5.7 percent to 31.2 percent, with an average of 16.5 percent across the nine courses. Presumably, a student who is willing to complete a survey is more willing to do everything else to complete a course, aligning with the commonplace finding that students who engage with any part of a MOOC are more likely to engage with other parts.7
With that caveat, certification rates varied substantially among students with different self-reported intentions. Those planning to browse had the lowest rates, ranging from .7 percent to 14.3 percent, with an average across courses of 5.9 percent. These certificate earners are potentially an important population: they represent students who explicitly stated an intention to just "shop" the course, but then went on to earn a certificate. Of those who intended to earn a certificate, between 9.1 and 35.7 percent were successful in doing so. The average across courses was 22.1 percent, quite close to what Koller and colleagues reported for the Writing in the Sciences course. Certification rates among those who intended to complete the course were higher than for students with other intentions and higher than the rate for all students in the course. That said, the majority of students who intended to complete a course — in some cases the overwhelming majority of students — were not successful in doing so.
A potential limitation of comparing these descriptive statistics is that, as table 2 shows, some courses have more students who intend to complete than others. Thus, I use logistic regression modeling to more concisely estimate the effect of intending to complete on the odds that a student completes a course.
Table 4 shows a taxonomy of logistic regression models predicting certification rate based on stated intentions, controlling for student demographic characteristics and the course's fixed effects. In these models, the reported value in each cell is an odds ratio. Odds ratios higher than one indicate a higher probability of certification associated with a given predictor, assuming all other predictors are constant. Odds ratios lower than one indicate a lower probability of certification associated with a given predictor, assuming all other predictors are constant. In all three models, the "browse" category of student intention is the reference category. Later, I report adjusted risk ratios — that is, the ratio of the mean predicted probabilities of certification — for the final model.
Table 4. Taxonomy of logistic regression models predicting course completion in the nine HarvardX courses.†
|
| Model A: Intention | Model B: with demographics | Model C: and with fixed effects |
|---|---|---|---|
| Intercept | .038*** | .021*** | .007*** |
| | |||
| Unsure | 1.94*** | 2.05*** | 2.11*** |
| Audit | 1.35** | 1.29 | 1.33* |
| Complete | 6.36*** | 6.54*** | 5.96*** |
| | |||
| Age |
| 1.02*** | 1.02*** |
| Education level |
| 1.15*** | 1.12*** |
| Female |
| .886*** | .861*** |
| English fluency |
| .884*** | .993 |
| Subject familiarity |
| 1.06*** | 1.10*** |
| U.S. resident |
| .738*** | .782*** |
| | |||
| Course fixed effects | Not Included | Not Included | Included |
| | |||
| N | 79525 | 41187 | 41187 |
| Pseudo r2 | .060 | .077 | .13 |
| | |||
| †Odds ratios and (standard errors); * p < .05; ** p <. 01; *** p <. 001. | |||
As a baseline, Model A includes only the student intention predictors. A strong positive association exists between the self-reported intent to complete a course and course completion. In Model B, I add demographic characteristics as control predictors, and in Model C, I add the fixed effects of courses. The strong positive association between intent to complete and completion persists in these subsequent models.
Computing adjusted risk ratios from the odds ratios in Model C, I estimate that an intended-completer is 4.5 times more likely to earn a certificate (p < .001) than an intended-browser, holding constant demographic characteristics. An intended-completer is 3.5 times more likely to earn a certificate (p < .001) than an intended-auditor.
A student's stated intention is a stronger predictor of course completion than any demographic predictor. Older students, students with more education, and students with greater initial familiarity with the course material all had higher odds ratios of course completion, and female students and U.S. residents had lower odds ratios of completion than others. Although these estimates are statistically significant, they are substantively modest.
Intention and Persistence
Attrition rates can illuminate the underlying mechanisms of completion rates and provide a more nuanced picture of student persistence. Indeed, nearly one-quarter of all survey respondents claim that they intend to complete only part of a course, so efforts to increase the persistence of these students — who still might never earn a certificate — are important to measure.
Koller and colleagues modeled persistence by examining the fraction of a course's videos that a student watches. Although this is a useful perspective, students in HarvardX courses learn not only through videos, but also through texts, problems, and other course elements; I therefore model persistence as a function of the percentage of total course days in which students are active.
Figure 1 shows the Kaplan-Meier survivor functions for five groups of students from the nine HarvardX courses: those who stated an intention to (1) browse, (2) audit, or (3) complete the course; those who stated an (4) unsure intention; and those who (5) did not respond to the survey. The x-axis shows the percentage of course time elapsed, from 0 percent to 100 percent; the y-axis shows the observed proportion of the cohort remaining. The plotted curves are called survivor functions; higher survivor functions indicate higher levels of persistence on average in the group.
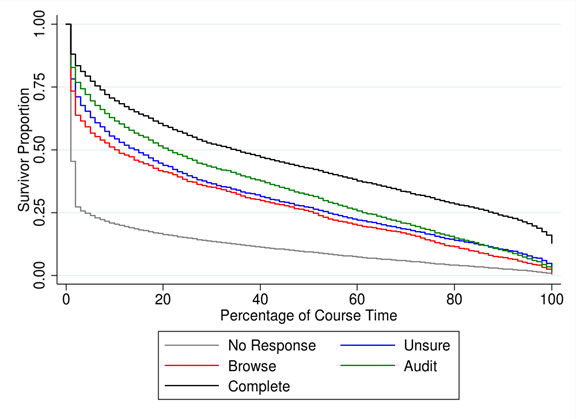
Figure 1. Kaplan-Meier survivor functions for students who did not respond to the pre-course survey
(n = 211,081); intended-browsers (n = 2,636); intended-auditors (n = 20,709);
intended-completers (n = 44,354); and students with unsure intentions (n = 11,826)
These survivor curves show that intended-completers persist longer than other registrants. Several other features of figure 1 are particularly interesting. First, all five cohorts of students experience sharp drops in the first 1 to 2 percent of a course. At all time points, those intending to complete are most likely to remain, followed by intended auditors, the unsure, and intended browsers. Among all four groups, the shape of these curves is quite similar. Although the initial drop's magnitude is different, the subsequent rate of decline is fairly similar.
A common way to summarize and compare survivor functions is to examine the median lifetime of different groups — in this case, the time at which half of a cohort has stopped out. For non-respondents to the survey, the median lifetime occurs before 1 percent of the course is complete. For intended browsers, the median lifetime is 10 percent of the course, while for intended completers it is 35 percent of the course.
As a complement to these survivor functions, figure 2 shows hazard functions for the four student groups by stated intentions, and these functions provide another view of attrition. The y-axis shows hazard probability — that is, the proportion of each cohort stopping out in any given period of time. The x-axis shows course time elapsed in bins for every 2 percent of course time. I constrain these observations to the first 96 percent of the course, because hazard rapidly approaches one after that.
Notice the large difference in hazard rates in the beginning of courses, ranging from .18 among intended browsers to .09 among intended completers. (Although not shown here, for survey non-respondents, hazard rate in the first two percentile units would be more than .5.) Soon, however, the hazard rates of all four groups stabilize at roughly the same level through the first half of the course. Intended-completers have a lower hazard rate at any given time than other groups. In the second half of the course, hazard rates for all groups begin to climb again, although they do so more slowly for intended-completers.
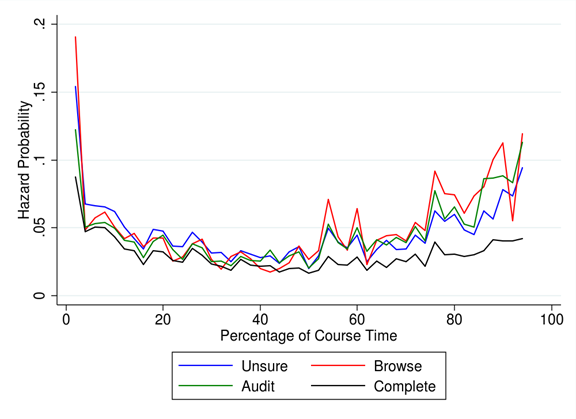
Figure 2. Hazard rates by stated intention for nine HarvardX courses
As I noted earlier, after examining video-watching behavior, Koller and colleagues hypothesized that their two latent groups of students — the high-retention and low-retention groups — had different constant attrition (or hazard) rates. If this model extended to my examination (in which attrition is a function of active course time), we would expect the hazard functions of intended-completers and intended-browsers to differ substantially across all times. That is, students who intend to complete the course should have a constant low hazard rate and students who do not intend to complete the course should have a constant high hazard rate.
Instead, it appears that no stated-intention group has a constant hazard rate over time; rather hazard rates vary considerably across the course's early, middle, and late periods. Students from all groups are likely to stop out in the first few days of a course, and all groups are less likely to stop out in the middle of the course. Between the 15th and 50th percentile unit of time in a course, hazard rates are below 5 percent in any 2 percent unit of course time. Instead, it is hazard ratio — the ratio of hazard rates among stated intention groups — that is roughly constant over time.
Although the baseline hazard rate varies over time, at any given time, intended-browsers are more likely to stop-out than intended-completers. During time periods in which hazard increases, it increases more sharply among intended-browsers than among intended-completers. Although perhaps a subtle point, as I discuss below, this distinction between ratio and rate has important substantive implications. The behavior of students with different self-reported completion intentions is, in some respects, more alike than different.
Discussion
As these findings show, students who intend to complete a course are more likely to do so. Now what?
Of the HarvardX students who responded to the pre-course surveys, 56 percent reported that they intended to complete their course. An average of 22 percent of these intend-completers across courses went on to actually earn a certificate.
By my estimate, a student who intends to earn a certificate is 4.5 times more likely to do so than a student who intends to browse a course and 3.5 times more likely to do so than a student who intends to audit a course, controlling for demographics and the fixed effects of course. Students who enroll in a course with the intent to finish do so at much higher rates than students who enroll in a course without intending to complete it. Still, the majority of those who intended to earn a certificate did not do so.
General Recommendations
My intuition is that these findings are probably not of a great enough magnitude to change most people's prior beliefs about MOOCs. For those concerned with MOOC attrition rates, these findings may do little to ameliorate concerns that MOOCs are an unsuitable learning environments for most students.
For those inclined to be excited about the opportunities that MOOCs afford, these findings indicate that completion rates among students committed to completing a course are several times higher than has been widely reported to date. As policymakers and university leaders debate the costs, benefits, and future of MOOCs, these findings provide a useful reference point, even if they are unlikely to settle key policy questions.
Recommendations for Course Developers
Course teams can use certification rates conditioned on intention as one indicator among many — ranging from course satisfaction to performance on learning assessments to persistence through course material to engagement on forums and in social media — to help characterize a course's success. The finding that 22 percent of students who intend to complete a course ultimately do so might prove to be a useful benchmark for course teams.
Key Takeaways for Course Developers
For course developers, my study offers three key insights.
- The completion rate benchmark is higher for students who intend to complete a course. Across nine HarvardX courses, 22 percent of students who intended to complete a course went on to earn a certificate. Other MOOC course teams might find this a useful benchmark to characterize a course's success, taking into account the unique details of each course.
- Learner intentions can change. On average across courses, 6 percent of intended-browsers, 7.5 percent of intended-auditors, and 10 percent of students with unsure commitments to the course earned a certificate. Some students who did not initially intend to complete a course were convinced to do so. These "intention flips" might be a greater indicator of course success than the students who inevitably attrite.
- Attrition happens early; course beginnings are important. Regardless of a student's stated intentions, attrition rates are highest in the early part of a course. Course developers should recognize that, for many students, a course's first unit is the only part some students will see. Course teams should consider allocating resources to making that beginning unit inviting and compelling.
One interesting group is the students who did not intend to complete a course but did so. On average across courses, 6 percent of intended-browsers, 7.5 percent of intended-auditors, and 10 percent of students who were unsure of their commitment earned a certificate. For courses whose purpose is to bring new people into a field, such statistics might be even more important than the percentage of intended-completers who actually complete a course. High dropout rates and anecdotal evidence have clearly shown that some people who intend to complete a course dropout, but these statistics suggest that the opposite appears to also be true: people go on to complete courses that they never intended to finish.
The study's findings should compel caution among those considering personalizing learning experiences according to students' self-reported intentions. Many students who did not intend to earn a certificate in these nine courses did so, while the majority of those who intended to earn a certificate did not. As more options for conditional logic and personal learning pathways become available in course platforms, these insights suggest that course developers should think carefully before giving students with modest intentions a lesser experience.
Course developers should pay particular attention to the characteristics of how attrition occurs over time. As other studies show,8 attrition is very high early in courses, and soon levels out at a relatively low level. One contribution of this article is to show that these patterns hold across all stated intention groups.
Nearly 10 percent of intended completers leave in a course's first few days. Students who intend to complete a course do not have low constant attrition rates, and students who do not intend to complete do not have high constant attrition rates. Rather, attrition rates vary considerably over time within courses, but the ratio among these hazard rates for students from different stated-intention groups remains fairly constant. These findings suggest that instructors concerned about attrition should consider focusing their efforts on building community and engagement in the early days of a course when attrition is highest. Such efforts can benefit all students, regardless of their stated intentions. Again, these findings raise cautions about developing adaptive or personalized approaches based on students' stated intentions. Retention patterns among students with different levels of stated intention look quite similar.
This study also yields one other important caution, useful to anyone following MOOC research: Students who express any intention at all are more likely to complete a MOOC than those who do not complete a pre-course survey. Across our sample of nine HarvardX courses from 2013–2014, the completion rate among all registrants averaged 6 percent compared with an average of 16.5 percent for survey respondents. This difference highlights an important caveat in examining completion rates across courses: Students who complete an optional pre-course survey can be very different from those who do not. Comparisons between students who state an intention to complete a course and all other students can be misleading; a more fair comparison should be between those who state an intention to complete a course and students who state a different intention.
Opportunities for Future Research
This research provides more precise estimates of MOOC certification and attrition rates conditioned on student intention, but one fundamental question remains: What would be a good certification rate for a MOOC? If 22 percent of students who intend to complete do so, is that still a disaster? A resounding success?
In the public discourse about MOOC completion rates, low completion rates have often been presented as self-evidently problematic.9 Few commentators or researchers have delineated exactly why low MOOC completion rates are of concern. However, these exact reasons are important, because course developers and policy makers might respond to different problems with different approaches.
Low passing rates might indicate that the quality of MOOCs is low, because many students choose not to persist through the entire course. Or, they might indicate that MOOCs are too difficult and fail to sufficiently support students' learning needs. MOOC certification rates might be low because registering for a MOOC is often a precondition to evaluating its worthiness, so students might often shop multiple courses before settling on a few to commit to. Low certification rates might also be due to people intending to complete only part of a course. Or, well-intentioned people might simply get overwhelmed by other commitments and stop out of a course even though they enjoyed it and were progressing well.
This research based on pre-course surveys provides a better, though still imperfect, sense of the intentions that students bring to a course. The findings can resolve some questions concerning how best to understand certification rates. For instance, if only slightly more than half of survey respondents intend to complete a course, it seems unlikely that open-enrollment MOOCs could ever expect to see certification rates higher than 50 percent for those respondents, no matter how wonderful the course's quality. And, if substantial numbers of people who do not intend to finish a course go on to do so, it might be a useful and novel indicator of how well MOOCs engage their audiences.
Conclusions
To better understand the meaning of MOOC attrition rates, researchers must learn much more about why people stop out of MOOCs. If students leave because they are overwhelmed with other commitments or because they have learned everything they needed to learn, the implications are very different than if they leave because they are disappointed in the course or are finding it too difficult.
This research has provided better answers to the question: Why do people come to these MOOCs? The next challenge is to get better answers to the question: Why do people leave?
In 2013–2014, HarvardX also attempted to survey students at the end of courses, but the effort was mostly unsuccessful. Response rates to these end-of-course surveys were very low. Most of the students who completed end-of-course surveys were very satisfied with HarvardX courses, but the respondents were students who had already persisted through months of voluntary challenges. Thus, the typical approach to course evaluation — asking all students to evaluate a course at its end — is unlikely to work in the MOOC context.
A great innovation in MOOC research would be to develop mechanisms to predict student stop-out behavior soon after a student's final action, and then survey the students about their reasons for leaving at that moment. This would offer a deeper understanding of what causes student attrition, which would in turn clarify what we might do to address it.
If researchers can discern how many students leave MOOCs because of life's other commitments, it might help estimate a reasonable ceiling on retention rates in voluntary, free, and open online courses. Further, uncovering how many students leave because they are dissatisfied with a course might help better estimate the MOOC attrition levels that course developers could realistically address through better instructional design.
- Jeffrey R. Young, "Are Courses Outdated? MIT Considers Offering 'Modules' Instead," The Chronicle of Higher Education, August 5, 2014.
- Justin Reich and Andrew Ho, "The Tricky Task of Figuring Out What Makes a MOOC Successful," The Atlantic, January 23, 2014.
- Kevin Carey, "Pay No Attention to Supposedly Low MOOC Completion Rates," EdCentral, Dec. 12, 2013.
- Daphne Koller, Andrew Ng, Chuong Do, and Zhenghao Chen, "Intention and Retention in Massive Open Online Courses," EDUCAUSE Review Online, June 3, 2013.
- This study included all HarvardX courses that (1) were offered between September 2013 and June 2014, (2) were hosted on the edX platform, (3) issued certificates to students who earned a sufficient grade, and (4) were the first module in a series (if the course was part of a series). Criteria (2) excluded Fundamentals of Neuroscience, which operated on a proprietary platform. Criteria (3) excluded two poetry courses that did not offer certificates. Criteria (4) excluded four modules of the ChinaX course, Parts 2–5. I include only students who enrolled before the wrap data — that is, the final date in which course materials were due in order to earn a certificate.
- Andrew Dean Ho, Justin Reich, Sergiy O. Nesterko, Daniel Thomas Seaton, Tommy Mellaney, Jim Waldo, and Isaac Chuang, "HarvardX and MITx: The First Year of Open Online Courses," working paper no. 1, HarvardX and MITx, 2014.
- Justin Reich, "Big Data MOOC Research Breakthrough: Learning Activities Lead to Achievement," Education Week, March 30, 2013.
- Ho et al., "HarvardX and MITx," 30.
- John Markoff, "Measuring the Success of Online Education," The New York Times, Jan. 17, 2013; and Jonathan Freeman, "MOOCs: Usefully Middlebrow," The Chronicle of Higher Education, November 25, 2013.
© 2014 Justin Reich. The text of this EDUCAUSE Review online article is licensed under the Creative Commons Attribution-ShareAlike 4.0 license.