
One key part of the Next Generation Digital Learning Environment involves the need for a central repository for learning analytics.

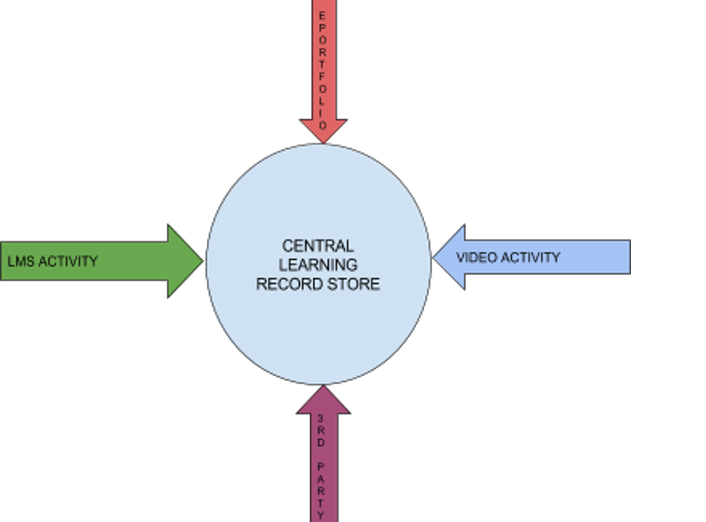
Since the 2015 release of the EDUCAUSE report The Next Generation Digital Learning Environment: A Report on Research, many articles have been written on various aspects of the NGDLE. In this post, we'll focus on the need for a central repository for learning analytics (see figure 1). Without a central repository, the learning environment — including LMS data and activity records for videos, e-portfolios, and third-party tools — becomes compartmentalized and stove-piped, making it difficult to provide a 360-degree view of the learner and learning environment. This makes it much more difficult to have a combined view of student learning activities that can allow instructors and program managers to ascertain the effectiveness of teaching and learning.
Learning Record Store
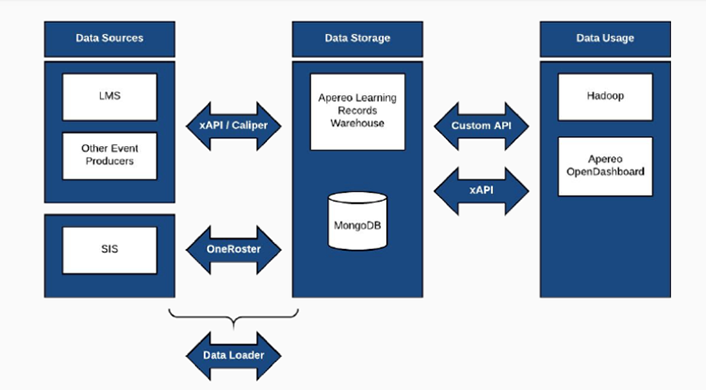
At the University of Notre Dame, we have been seeking an integrated view of student learning interactions so that we could conduct holistic analytics to improve student learning outcomes. The learning record store (LRS) is a construct that was originally developed by Advanced Distributed Learning to be the storage mechanism for the Experience API or xAPI, the next generation of SCORM, but it has also become the de facto standard for storage of Caliper and xAPI learning data. There are several open-source and proprietary versions of the LRS, and at Notre Dame, after reviewing several options, we chose to implement the Apereo Open Learning Record Warehouse for providing this 360-degree view of student interactions (see figure 2).
We made this choice for a few reasons:
- It allows multiple feeds of xAPI and Caliper data to one repository.
- It presents an integrated view of student activity gathered from data sources, such as LMS, video repositories, e-portfolios used in courses, and third-party tools that are xAPI or Caliper compliant. The system can also include data from ID card tracked activities, such as guest lecture attendance, and other sensor data (multimodal analytics).
- It works in near real time, depending on the latency of data sources.
At Notre Dame, we are in the process of implementing all of the above with the exception of the Hadoop predictive analytics module. We are evaluating the predictive analytics to determine how they might best be utilized at Notre Dame.
This framework has been implemented at several US universities including Marist College, Savannah State University, College of the Redwoods, Cerritos Community College, and North Carolina State University. Parts of this framework have been adopted by the large Jisc initiative on learning analytics in the UK involving 50 universities. The University of Michigan is also using the Learning Record Warehouse component of the framework.
Notre Dame's Implementation of Apereo Open Learning Record Warehouse
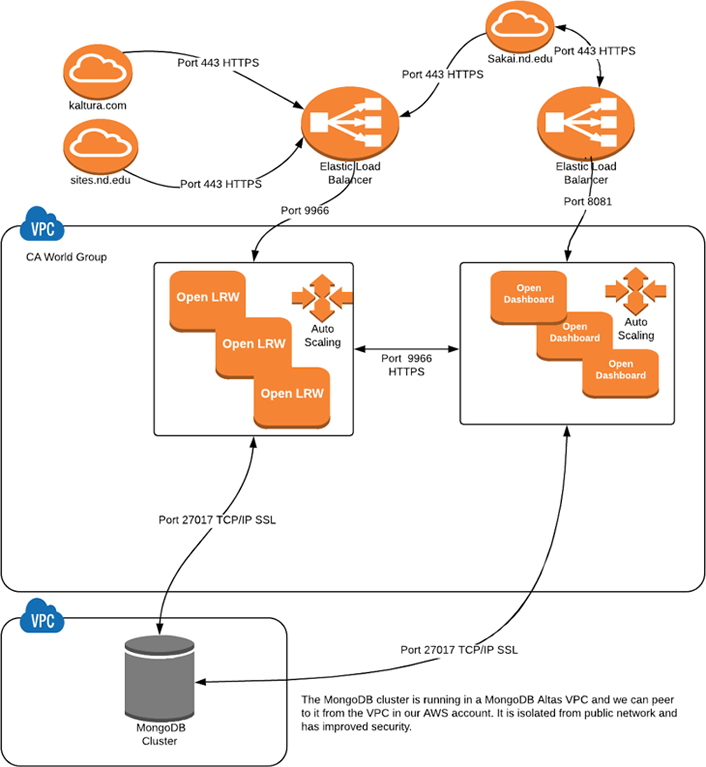
Because Notre Dame has an ongoing cloud-first initiative, we implemented the framework in our Amazon AWS environment (see figure 3).
Sample Data and Visualizations
The following examples describe data coming from various tools that provide either xAPI or Caliper data feeds. Each data sample is accompanied by a visualization, followed by a visualization of all the activity in a combined view.
Example 1
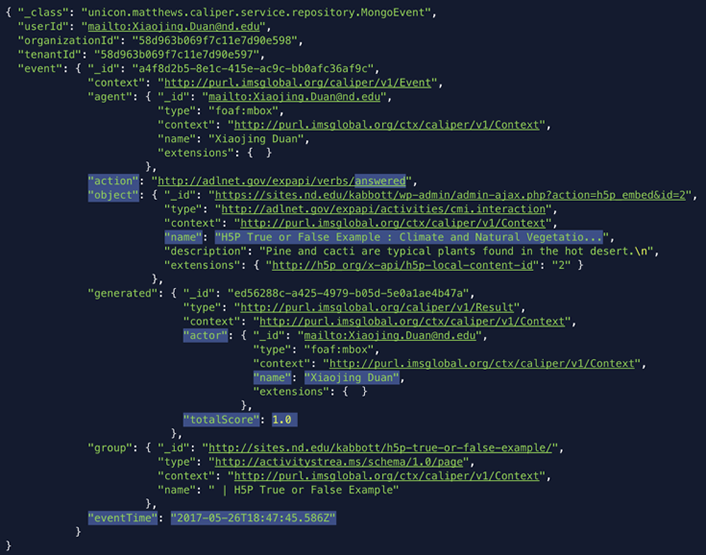
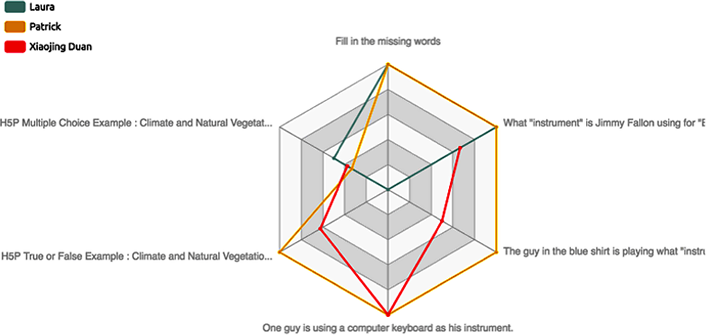
H5P is a tool that enables the creation of interactive content such as interactive videos, games, hotspot questions, and flashcards. H5P sample data below show that student Xiaojing Duan answered the "H5P True or False Example: Climate and Natural Vegetation…" question and scored "1.0."
This sample radar chart shows different students' scores on different H5P questions:
Example 2
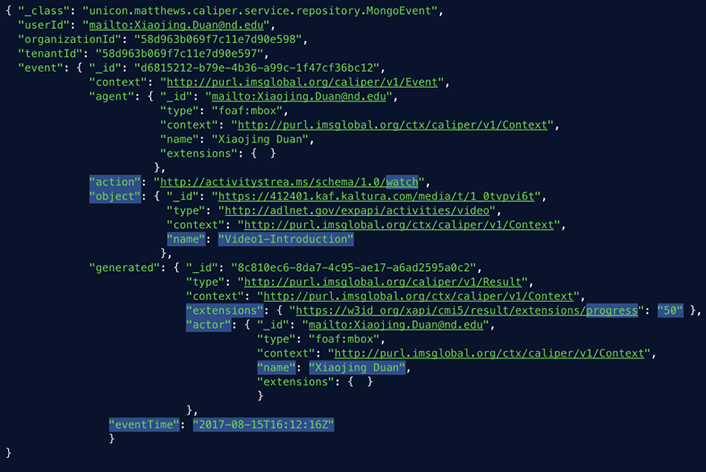
Kaltura is a video repository used at Notre Dame. Here, sample data show that student Xiaojing Duan watched the video "Video1-Introduction" and stopped at 50%.
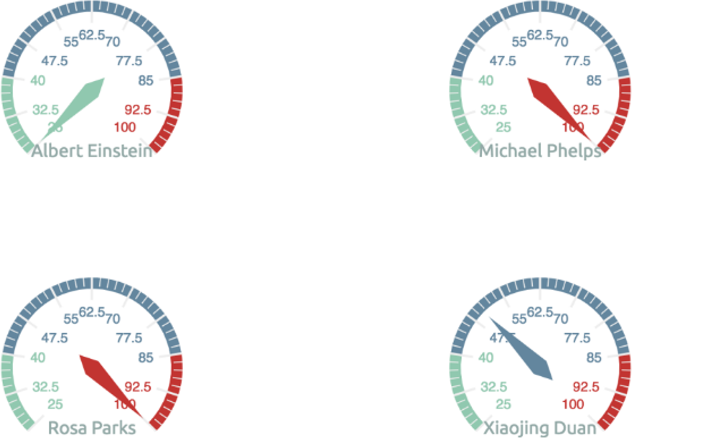
This gauge chart shows the maximum percentage of "Video1-Introduction" watched by different students:
Example 3
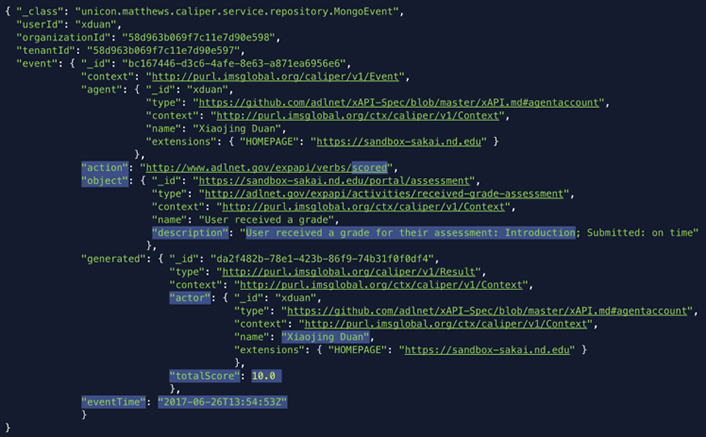
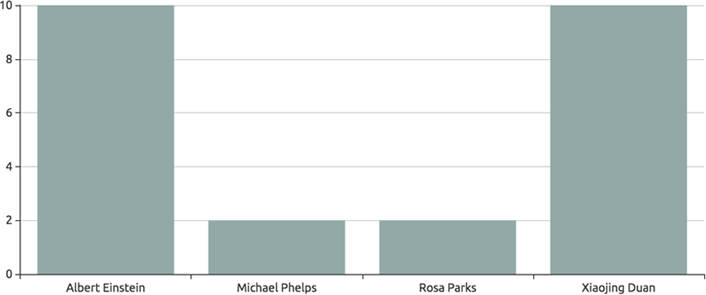
Sakai Tests and Quizzes sample data show that student Xiaojing Duan scored "10.0" in the "Introduction" quiz.
This bar chart displays different students' scores in the "Introduction" quiz:
Example of Combined Data in the Learning Record Warehouse
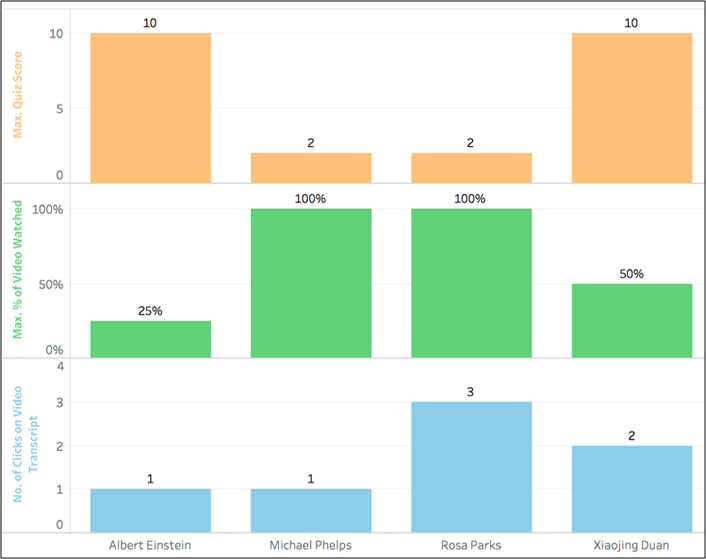
Because all of the data from different sources are stored in a centralized learning record warehouse (LRW), we can easily merge them and gain a critical 360-degree view of students' learning behavior, which enables us to study the correlation between behavior and learning outcomes. The bar chart below (see figure 4) shows students' quiz scores versus their video watching and transcript clicking.
Next Steps
Because this is a work in progress, we have not yet implemented integrated dashboards that can be fed back to instructors and students. Our next step is to create dashboards of students' online learning activities and share them with instructors directly from our LMS (Sakai).
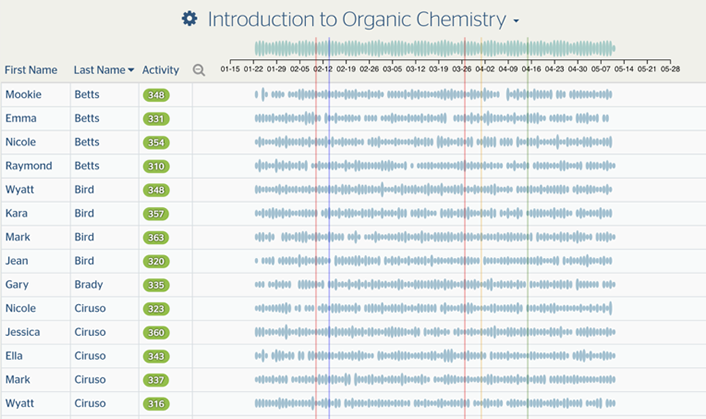
The first sample dashboard shows all students' activity from sample data in the LRW of an Introduction to Organic Chemistry class (see figure 5). The first dashboard shows how the dashboard would appear for the entire class.
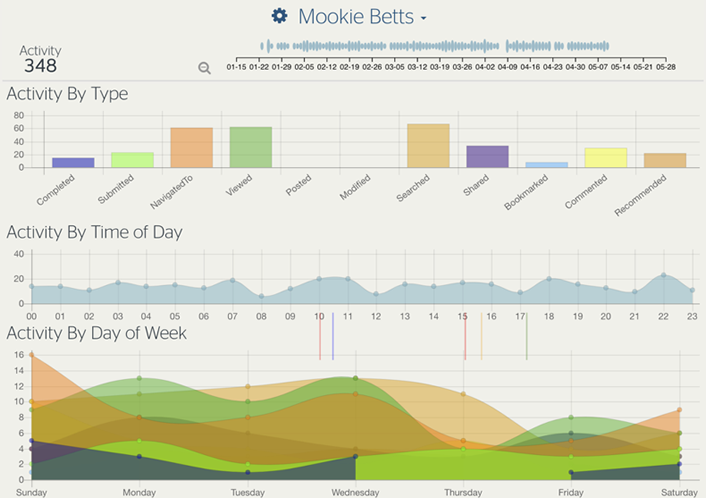
This second dashboard (see figure 6) shows student Mookie Bett's individual activity in the Introduction to Organic Chemistry class.
Lessons Learned
In our implementation thus far, we have learned several important lessons.
Data Quality
Gaining insights from learning analytics depends on the richness of the activity data available from the various parts of the learning ecosystem. For example, if the LMS is used simply as a central file storage for PowerPoint or PDF files, you will not get much insight into student engagement. If instructors are using online quizzes, assignments, embedded videos, forums, and other interactive learning objects, they will gain a richer view of student engagement in the learning records and dashboards and ultimately will have access to better predictive analytics.
Standards
The learning record store/warehouse depends on learning platforms' compliance with the xAPI and Caliper standards. Because Caliper is new, not many platforms are providing API data conforming to that standard. Kaltura, for example, is one of the few multimedia vendors that now supports Caliper. Also, although xAPI is an older standard and more vendors provide data meeting that standard, it is a looser standard. As a result, sometimes adjustments need to be made to xAPI feeds to provide all the data that are required. For example, our own Sakai LMS was not providing course site consistently in xAPI feeds, so we needed to do a fix to Sakai.
Overhead of Open Source
The Apereo Open Source Learning Analytics is evolving, so the framework components have changed considerably from the original version. This has required more time to perform the upgrade than was originally anticipated. The advantage of open source is that you have more control over your analytics, but it does require more time and resources to set up the infrastructure.
Patrick Miller is Team Lead for Learning Management in the Learning Platforms group of the University of Notre Dame's Information Technology Service Delivery department and serves as project manager for this project.
Xiaojing Duan serves as Learning Platforms Engineer at the University of Notre Dame and is technical lead for this project.
© 2018 Patrick Miller and Xiaojing Duan. The text of this work is licensed under a Creative Commons BY 4.0 International License.