
Key Takeaways
-
Findings from two research studies at scale reveal the implications of learning analytics research for designing courses in learning management systems.
-
Data-driven interventions shine light on our institutional conceptions of learning, who our students are, and our responsibility — or perhaps our willingness — to support students.
-
By focusing the lens of analytics on course design, we may be able to define success in a way that is more intuitive and compelling to faculty and thus facilitates a more scalable approach toward course redesign for improved student success.
In 2014 the EDUCAUSE Center for Applied Research (ECAR) identified three key motivators for faculty use of IT: (1) evidence of benefit to students, (2) course release time, and (3) confidence the technology will work.1 Typically, deans and chairs are responsible for no. 2, and IT support handles no. 3. But who is really responsible for no. 1? And can we ever fully agree on what success looks like? Given the pace of innovation and diversity of faculty uses of educational technologies, how can we figure this out at scale? Learning analytics offers a way to provide evidence of this benefit — advocated in principle by many authors — and we've both been conducting experiments and research studies in our professional practice for several years.
In this article we briefly summarize two recent, large-scale learning analytics studies and discuss our findings. Although our studies were developed independently, both depart from the conventional practice of studying learning management system (LMS) activity to better understand individual students. Instead, we use student activity and grades to better understand effective course design. In particular, we found that faculty use of the grade center, which ECAR found that students value more than any LMS function,2 is positively related to student outcomes. We offer our studies as a way to operationalize learning analytics to improve LMS course design, which we believe is an emerging and highly scalable form of institutional intervention to improve student success.
A Thought Experiment
To frame our discussion, consider the following: If you could predict with 100 percent accuracy which students would succeed or fail — in classes, programs, or graduation — what would you do to intervene and change the predicted outcome? Or as Mike Sharkey, VP of Analytics at Blackboard, often says, "If you're a dog chasing a car, what would you actually do if you caught it?"
In our experience, this critical transition from prediction to intervention (and assessment of the resulting impact) is actually quite rare in higher education learning analytics research and practice. It may be contributing to what we perceive as the transition of learning analytics into the "trough of disillusionment" predicted by the Gartner Hype Cycle,3 or the "analytics angst" reported by Casey Green in the 2016 Campus Computing Survey results.
In some ways, this angst is fortunate for those of us dedicating our careers to learning. For better or worse, data-driven interventions (or lack thereof) shine light on our institutional conceptions of learning, who our students are, and our responsibility — or perhaps our willingness — to support them. With this in mind, we'd like to share two recent complementary research findings that demonstrate the potential of course design as both a learning analytics variable and an intervention strategy.
UMBC LMS Use and Student Achievement (2013–14)
John Fritz, Assistant Vice President, Instructional Technology, Division of Information Technology, University of Maryland Baltimore County (UMBC)
I conducted this study for my doctoral dissertation, a key focus of which was to explore the impact of sharing feedback about student LMS activity with students themselves, especially compared to an anonymous summary of peers. I also wanted to explore whether faculty use of the LMS — as expressed in their design choices and deployment of certain tools or functions — was related to how students subsequently used the LMS course. To do so, I felt the need to establish a baseline of whether there was a relationship between student LMS activity and grades, a point that has not always been clearly established in the few empirical studies to date.
As such, this study involved all of UMBC's 2,696 first-time, full-time freshmen and transfer students enrolled in 1,530 distinct course sections across nearly all disciplines in academic year 2013–14. Like many schools, UMBC focuses particularly on success rates of these first-year students. Generally, my freshmen and transfer sample represented a slightly higher use of our Blackboard Learn LMS compared to the campus overall, which typically is used by 96 percent of all students, 87 percent of all instructors, and 82 percent of all course sections. To define "usage" by faculty and students more specifically, I analyzed the courses they taught or were enrolled in based on two criteria:
- If and how instructors enabled the LMS course and functions for students to use, broadly categorized in the research literature as content, tools, and assessments.4
- If and how students used these courses, as measured by course accesses (logins), interactions (hits or clicks), or duration (minutes accrued before a 5-minute inactivity timeout)
Two key findings emerged from this study, after controlling for demographic/educational preparedness factors such as gender, race, age, Pell eligibility, academic preparation, and admit type:
- Students who used the LMS were 1.5 to 2 times more likely to earn a C or better compared to students who did not use the LMS in fall 2013 and spring 2014. In a similar finding, students who used the LMS were 2.4 to 2.8 times more likely to earn a 2.0 term GPA compared to students who did not use the LMS in fall 2013 and spring 2014.
- When viewing student LMS activity and whether faculty enabled the grade center as an interaction effect — where the effect of one independent variable depends on the level of another independent variable — students were 1.6 to 2.5 times more likely to earn a C or better in their LMS courses that used the grade center compared to courses that did not provide students with grade information. In particular, the highest student activity and grade center interaction effect occurred among freshmen; these students were 2.6 to 3.5 times more likely to earn a 2.0 term GPA.
Figure 1 below shows an interesting relationship between student LMS activity (engagement), grades in the course site, and the sample's eventual retention at the university (the transfer sample was essentially the same, as were both groups across both fall 13 and spring 14). Notice how students who are active but not performing well (#3) persisted at slightly higher rates than higher performing but less engaged peers (#2). Which group might your institution focus on in terms of intervention? Also, how could we even understand this relationship if faculty didn’t use the grade center of a central IT system like the LMS?
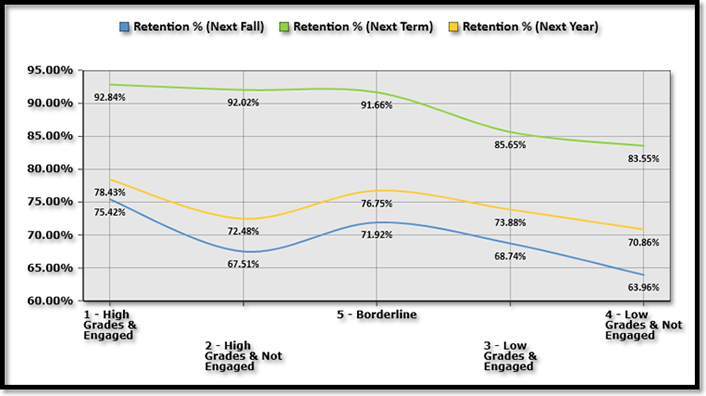
Figure 1. Freshmen and transfer retention by LMS grades and engagement, fall 2013
To be clear, the LMS grade center does not magically improve student grades through simple inclusion of the tool. I believe that the grade center is a proxy for course design, specifically:
- Grade center use often reflects a course design practice of using auto-graded quizzes, either for formative practice or summative assessment, which an LMS does well. This could support the "testing effect" that learning science research has shown to be one of the best ways for students to learn, by forcing them to recall and apply knowledge, preferably in frequent "low stakes" settings vs. infrequent "high stakes" settings like midterms and finals, that might encourage a cram and purge vs. a learn, recall and apply approach.5
- The opportunity for early feedback helps students make corrections and improve their self-regulation. Some faculty prefer to keep grades offline in Excel, but unless grades are frequently shared with students, preferably in comparison with each assignment's class average, offline grade books provide little feedback that students can use to gauge and improve their performance.6
- A current, 24/7 grade center could help lessen the burden on faculty of dealing with the inevitable administrivia and student lobbying about grades, both in and out of class. No, it won't eliminate these pressures, but if the grade center can serve as the "you are here" indicator on a map, throughout the semester, it might facilitate deeper conversations about learning between students and their teachers.
Large-Scale LMS Course Tool Use and Student Achievement (2016)
John Whitmer, Director of Learning Analytics and Research, Blackboard
Single-course research has found statistically significant relationships between student time spent in LMS course activities and their grades,7 but larger scale studies have found no relationship or low effect sizes.8 These findings led Blackboard's data science team to investigate the relationship between use of the LMS and student achievement, to better understand the specific conditions under which LMS use has an impact on student achievement.
We took a sample of Blackboard Learn v9.1 course activity from spring 2016 in North America. Data was anonymized at the individual and institutional level; aggregate data was used for analysis. We filtered for course features likely to provide a substantial student learning experience and give enough data for robust analysis: between 10 and 500 students, a mean time per student of at least 60 minutes, and use of the gradebook (to provide our dependent variable). We sampled 70,000 courses from 927 institutions, with 3,374,462 unique learners. After filtering the resultant data set included 601,544 learners (16 percent) in 18,810 (27 percent) courses. Any effect at this scale of study represents substantial findings, as there are a large number of potential confounding effects that would dilute any effect that was not extremely strong.
Finding 1: Complexity in Use and Impact of the LMS between Courses
In an initial study of this data, we found that use of Blackboard Learn varied greatly within and across institutions; the relationship between time spent in the LMS and student grade was statistically significant in 22 percent of courses; the effect of this relationship ranged from nearly no impact to almost a direct relationship, with most of the effect around 15–25 percent. This initial finding leads to the follow-on question: What course characteristics make LMS use have a greater impact in some courses than others, especially reviewed from data easily captured at scale? We clustered the data by obvious categories: course enrollment size, institution, average course activity — and nothing substantially explained the variation.
We decided to pursue the question by looking at different data – rather than looking at overall time spent in the course, we looked at time students spent using specific tools.
We investigated the top tools used among all courses in the sample (Course Content, Assessments, MyGrades, Announcements, Discussions, Assignments, and others). Among these tools (as illustrated in figure 2) we found that student access to MyGrades was related to a greater likelihood of earning a high grade (>80 percent) at every quartile of use.
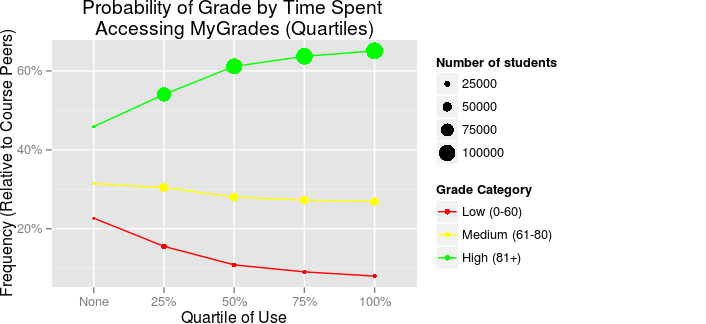
Figure 2.Student access to MyGrades and grades9
This finding contrasted with the results for every other tool. Although predictive, tool use above the mean for most other tools was related to a decreased likelihood of earning a high grade, although this relationship varied widely between tools and at different points in the use.
Similar to John Fritz's UMBC study, we found that student inactivity using the LMS was a strong predictor of grade. In particular, students who did not access course content at all had a higher likelihood of failing a course than did students who accessed course content (see figure 3). Given the relative rarity of failing a course within this sample, this finding was striking.
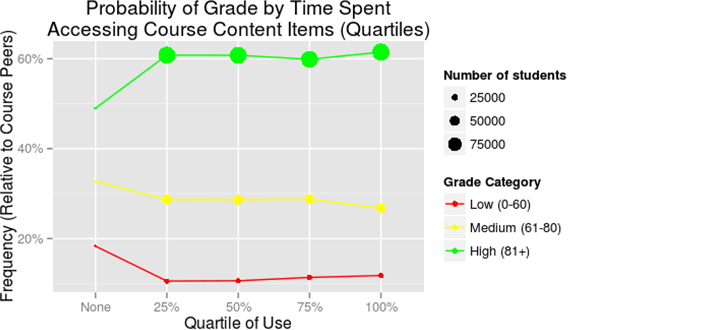
Figure 3. Student access of LMS content vs. grade
Implications
While our two studies differ in scale, methodology, and even findings, both studies clearly indicate that the use of the LMS, and more importantly specific tools within the LMS, are significantly related to student achievement and thus have implications for course design. These studies clearly demonstrate that the inclusion of grade information in LMS courses, as well as student access to those grades, is related to improvements in student achievement.
Of course, we aren't suggesting that faculty only need to use the grade book or that students only need to look at their grades to improve learning outcomes; the use of these tools necessitates deeper underlying changes to pedagogical practices by faculty (namely, changes in assessment techniques) and study habits by students (namely, changes in self-regulated learning). But learning analytics provides us with a powerful technology and set of methods that we can use to evaluate the impact of these techniques, achieved through commonly available technologies, at a scale and scope dramatically improved from other tools that we have available.
We believe that making changes to course design, and studying these practices as they affect students, can "lift all boats." Redesigned LMS courses can reduce the number of students who struggle to meet their educational goals and, we hope, the number of students "at risk." The analytics also provide evidence for deep pedagogical transformations enabled through technology.
Conclusion
We can choose to follow the peaks and valleys of the analytics hype cycle, or use this opportunity to reflect more critically on the progress we've made, what we've learned in the process, and opportunities for where to go next. In addition to refining predictive analytics to inform more empirical studies of interventions that improve student success, we propose using quantitative evidence of impact at a bird's-eye view of any technology system to inform and drive a deeper qualitative investigation that helps faculty connect around solving pedagogical problems through course redesign. As UMBC's President Freeman Hrabowski has said, "If you want to change a culture, shine light on success." By focusing the lens of analytics on course design — not just student performance — we may be able to define success in a way that is more intuitive and compelling to faculty and thus facilitates more scalable transformation of teaching and learning.
Notes
- Eden Dahlstrom, D. Christopher Brooks, and Jacqueline Bichsel, "2014 Student and Faculty Technology Research Studies," EDUCAUSE Center for Analysis and Research, 2014.
- Judith Borreson Caruso and Gail Salaway, "The ECAR Study of Undergraduate Students and Information Technology, 2007: Key Findings," EDUCAUSE Center for Applied Research, September 2007.
- Jan-Martin Lowendahl, "Hype Cycle for Education, 2016," Gartner, July 1, 2016.
- By default, we auto-create and enroll a Blackboard LMS site for every course in the schedule of classes. However, we leave it to the instructor of record to make the Bb site available to students. In this way, using the LMS is an intentional act by faculty, complemented by accepting or modifying our default template design, which they are free to do. See John Fritz, "LMS Course Design as Learning Analytics Variable," Proceedings Learning Analytics and Knowledge Conference '16, ACM, Edinburgh, Scotland, April 25, 2016.
- For a good primer, see Benedict Carey, "Why Flunking Exams Is Actually a Good Thing," New York Times, September 4, 2014. A recent journal article summarizes the research literature and raises an interesting question of when the testing effect applies and when it may not, especially in educational settings. See Tamara van Gog and John Sweller, "Not New, but Nearly Forgotten: The Testing Effect Decreases or Even Disappears as the Complexity of the Learning Material Increases," Journal of Educational Psychology Review, Vol. 27, Issue 2 (2015): 247–264; doi:10.1007/s10648-015-9310-x.
- Zimmerman, B. J., & Schunk, D. H. (2001). Self-regulated learning and academic achievement: Theoretical perspectives. Routledge.
- Shane P. Dawson, Erica McWilliam, and Jen Pei-Ling Tan, "Teaching smarter: How mining ICT data can inform and improve learning and teaching practice," paper presented at the Annual Conference of the Australasian Society for Computers in Learning in Tertiary Education 2008, Melbourne, Australia, 221–230.
- John Fritz, "Classroom walls that talk: Using online course activity data of successful students to raise self-awareness of underperforming peers," The Internet and Higher Education, Vol. 14, No. 2 (2011): 89–97; doi: 10.1016/j.iheduc.2010.07.007
- These tables plot lines for students earning grades in three categories: low, medium, and high. The x-axis is the amount that each student used the tool referenced, in relationship to their peers within that same course. This use is separated into categories by percent buckets. The y-axis is the percentage of students within a course receiving the grade specified. At each quartile marker is a dot whose size shows the relative number of students within each course receiving that grade. Taken as a whole, this chart illustrates the trends in use of tools and the relationship with the student's grade. The grade totals do not sum to 100 percent, as they are calculated relative to each course in the data sample.
John Fritz is assistant vice president of Instructional Technology, Division of Information Technology, University of Maryland, Baltimore County (UMBC).
John Whitmer is director of Learning Analytics and Research for Blackboard.
© 2017 John Fritz and John Whitmer. The text of this article is licensed under Creative Commons BY-NC 4.0.