
This article is drawn from the recent research by the EDUCAUSE Center for Analysis and Research (ECAR) and Gartner researchers on the state of analytics in higher education. This research explores the analytics trends as well as future predictions for the deployment of analytics technologies. Publications include The Analytics Landscape in Higher Education, 2015; Institutional Analytics in Higher Education; and Learning Analytics in Higher Education. More information about the analytics maturity index and deployment index can be found in the EDUCAUSE Core Data Service (participating) and the EDUCAUSE Benchmarking Service.

In Lewis Carroll’s Through the Looking-Glass, Alice finds herself running hand in hand with the Red Queen. The Queen prompts Alice to run faster and faster, since they are almost “there.” At the point of exhaustion, Alice stops and is propped against a tree by the Queen. With surprise Alice realizes that they haven’t moved beyond their starting point, despite all the running:
“Everything’s just as it was!”
“Of course it is,” said the Queen, “what would you have it?”
“Well, in our country,” said Alice, still panting a little, “you’d generally get to somewhere else — if you ran very fast for a long time, as we’ve been doing.”
“A slow sort of country!” said the Queen. “Now, here, you see, it takes all the running you can do, to keep in the same place. If you want to get somewhere else, you must run at least twice as fast as that!”1
The Red Queen metaphor is particularly relevant to understanding the progression of analytics capabilities in higher education over the last few years. The intended destination is to “do” analytics — use data, statistical analysis, and explanatory and predictive models to gain insight and act on complex issues — across the business and learning domains of higher education.2 The question is, Are we getting closer to our destination? Or are many of our institutions, like the Red Queen, running twice as fast (working twice as hard) to stay in pretty much the same place? In what areas are we leading or lagging, and how can we make progress to mature our analytics capabilities — that is, to move the Red Queen forward on the analytics chessboard?
To help institutions better understand their progress with analytics in higher education, EDUCAUSE developed maturity and deployment indices to measure and benchmark analytics practices (see the “EDUCAUSE Maturity and Deployment Indices” sidebar). By providing evidence regarding the current levels of analytics development, identifying areas of strength and weakness, and formulating responses that proactively move the proverbial needle in the desired direction, these indices can help institutions engage in analytics strategic planning and management. The EDUCAUSE Center for Analysis and Research (ECAR) released the first stand-alone analytics maturity index in 2012. This first-generation version of maturity modeling served as a basis for the analytics maturity index that is now part of the EDUCAUSE Core Data Service (CDS). The current index measures 32 factors contributing to analytics maturity and is organized into six dimensions:
- Decision-making culture, including senior leadership commitment and the use and cultural acceptance of analytics
- Policies, including data collection, access, and use policies
- Data efficacy, relating to quality, standardization, and “rightness” of data and reports and the availability of tools and software for analytics
- Investment/resources, consisting of funding, an investment-versus-expense mentality, and the appropriateness of analytics staffing
- Technical infrastructure, consisting of analytics tools and the capacity to store, manage, and analyze data
- IR involvement, capturing interaction between the IT and the IR (institutional research) organizations3
A score on a scale of 1 (absent/ad hoc) to 5 (optimized) is calculated for each of the dimensions, and the mean of those scores is the overall institutional maturity score. This score provides a way for an institution to determine where its analytics Red Queen is and to assess if, to what extent, and in what areas the Queen is moving forward.
EDUCAUSE Maturity and Deployment Indices
EDUCAUSE uses maturity and deployment indices to track higher education’s progress in delivering IT services. Maturity indices measure the capability to deliver IT services and applications in a given area. They examine multiple dimensions of progress (not just technical ones) such as culture, process, expertise, investment, and governance. They enable institutions to determine where they are and where they aspire to be. Deployment indices measure stages of deployment for specific technologies and services, which are aggregated to track progress in a domain. The analytics maturity and deployment indices are based on contributions to the EDUCAUSE Core Data Service, an annual survey and benchmarking service open to all higher education institutions.
Source: More information can be found via the EDUCAUSE Benchmarking Service.
Analytics Maturity in Context
Analytics has made the EDUCAUSE annual Top 10 IT Issues lists for four of the last five years, solidifying the issue as one with relevance and enduring strategic importance. When EDUCAUSE first measured analytics maturity as part of the 2012 ECAR research study Analytics in Higher Education: Benefits, Barriers, Progress, and Recommendations,4 we calculated an overall composite maturity rating of 3.2 (mean on a 5-point scale across all factors). For the 339 IT and IR leaders who responded to that survey, the middling (not too low and not too high) assessment was not surprising, given that the marketspace for analytics technologies, tools, and talent was still somewhat limited. Since 2012, the resources in the analytics marketspace have expanded, so it was somewhat surprising (at first glance) to find that the overall composite maturity rating across higher education had inched ahead to only 3.4 in 2014 and was flat (3.4 again) in 2015 (see figure 1).5 Yet though the practical significance of moving from a mean 3.2 to 3.4 composite maturity score over three years is not impressive at face value, this change represents a statistically significant step forward for the community’s overall mean. Any upward movement of the needle represents marked improvement in maturing analytics capabilities. So perhaps the Red Queen is moving forward, just at a disproportionately slow pace when contrasted to the level of interest among higher education leaders.
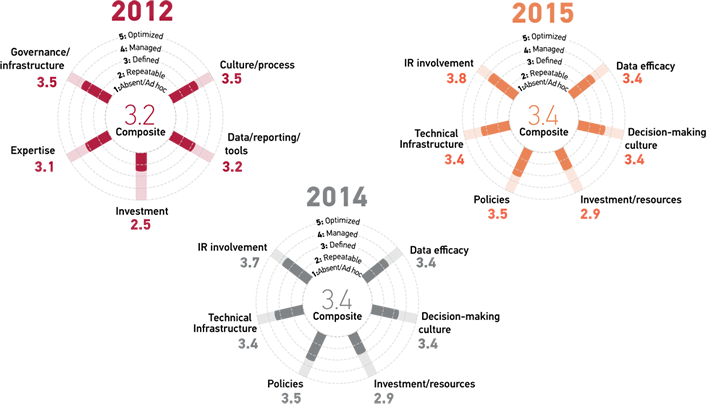
Source: Jacqueline Bichsel, Analytics in Higher Education: Benefits, Barriers, Progress, and Recommendations (Louisville, CO: ECAR, 2012); EDUCAUSE Core Data Service, 2014 and 2015.
Figure 1. Evolution of Analytics Capabilities
Investment/Resources: The Least Mature Dimension of Analytics
Individual maturity index dimension scores remained relatively consistent from year to year. Responses for each are expectedly anchored near the midpoint of the 5-point scale used to measure maturity. Individual mean maturity scores remained the same in 2015 as they were in 2014.6 Institutional Research (IR) involvement is notable because it endures as the most advanced dimension; it is not uncommon to find the Director of Institutional Research in a leadership or significant support role in analytics. On the other hand, the dimension of investment/resources endures as the least advanced. “Despite widespread interest, analytics is still not regarded as a major institutional priority at most institutions. Investment is more often described as minor rather than major. Institutions where analytics is a major priority are more likely to report a major investment in it” (see figure 2).7
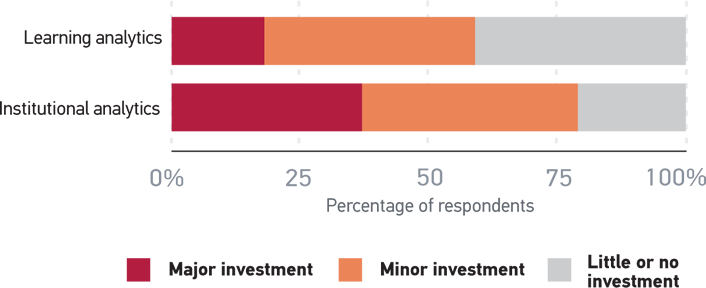
Source: Ronald Yanosky, with Pam Arroway, The Analytics Landscape in Higher Education, 2015 (Louisville, CO: ECAR, 2015), 8.
Figure 2. Investment in Analytics
Investment in institutional analytics (i.e., analytics intended to improve services and business practices across the institution) exceeds investment in learning analytics (i.e., analytics intended to improve student success). This awareness provides some insight as to what drives investment decisions. Learning analytics is primarily driven by improving student retention; institutional analytics is primarily driven by optimizing resources. That said, two of the top three drivers for both types of analytics are the same: improving student retention and demonstrating the value of higher education’s effectiveness. These two drivers provide a return on investment for learning analytics and institutional analytics. As noted by the 2015 ECAR research study The Analytics Landscape in Higher Education: “Improving student retention, reducing students’ time to degree, and improving student course-level performance (and therefore reducing remediation or dropout) are good business practices that also directly support student success.”8 The differentiator in what motivates greater investment in institutional analytics over learning analytics is interest in optimizing resources. The promise of analytics to realize institutional business interest to improve operational efficiencies and optimize business practices fuels investment.
Interest, Priority, and Investment
Investment in analytics is the natural result of analytics becoming an institutional priority and gaining widespread institutional interest. Taking a closer look at the relationship between interest, priority, and investment provides insight about why investment/resources in analytics lags behind the other dimensions. In the 2012 ECAR research study, approximately two-thirds (69%) of respondents said that analytics was a major priority for at least some departments, units, or programs and that it would gain importance over the next two years. In the 2015 ECAR research study, this prediction proved true for institutional analytics (77% of respondents said it was a priority) but not for learning analytics (49% of respondents said it was a priority) (see figure 3).9
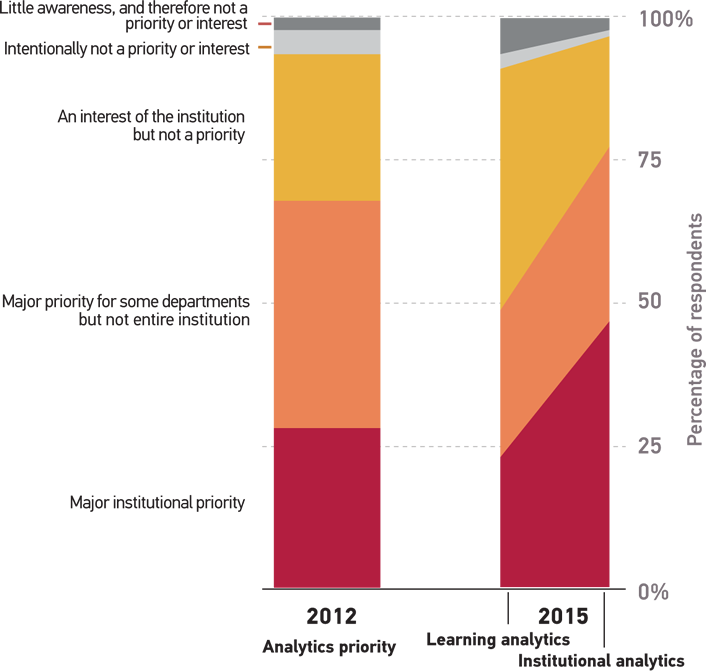
Source: Ronald Yanosky, with Pam Arroway, The Analytics Landscape in Higher Education, 2015 (Louisville, CO: ECAR, 2015), 7.
Figure 3. Priority of Analytics
Investment Opportunity: Talent
There are three major investment opportunities for maturing analytics capabilities: talent, technology, and tools. Analytics talent is tracked in two places, primarily in the EDUCAUSE maturity index and also in ECAR analytics research. In the maturity index, six of the nine items that make up the investment/resources analytics dimension are related to people (talent):
- We have IT professionals who know how to support analytics. (3.5)
- Our analysts know how to present processes and findings to stakeholders and to the broader institutional community in a way that is visually intuitive and understandable. (3.1)
- We have business professionals who know how to apply analytics to their areas. (3.0)
- We have dedicated professionals who have specialized analytics training. (2.9)
- We have a sufficient number of professionals who know how to support analytics. (2.5)
- We have an appropriate number of data analysts. (2.4)
The two least-developed talent items in the maturity index speak to quantity of staff, whereas the other four items speak to the quality of the staff already in place. This is an important point to note: the primary talent barrier to maturing analytics capabilities is the number of staff available to do the work, not the skills of current staff in analytics support roles.
The 2015 ECAR research study identified which analytics staff roles are in place and which roles have the greatest need for more staff to support analytics. The top analytics roles needed are in predictive modeling (92% of institutions), analytics tool training (89%), data visualization (88%), user experience development (87%), and data analysis (87%). “All of these except data analysis are currently in place at fewer than 6 in 10 institutions. The near-universal desire to add predictive modeling skills indicates a wish to move from a reporting orientation to a higher order of understanding and action.”10
Investment Opportunity: Tools and Technologies
Shifting our focus to the tools and technologies that institutions need in order to mature the capacity for analytics, we look to the EDUCAUSE deployment index. This index complements the maturity index (which measures the institution’s ability to deliver technologies and services) by measuring which technologies and services are actually being delivered. The analytics deployment index consists of 11 analytics services and technologies that subject matter experts identified as being key. Although these do not represent the entirety of analytics services and technologies that institutions are delivering, they do provide a basic overview of critical capacity-building resources for analytics (see figure 4).11
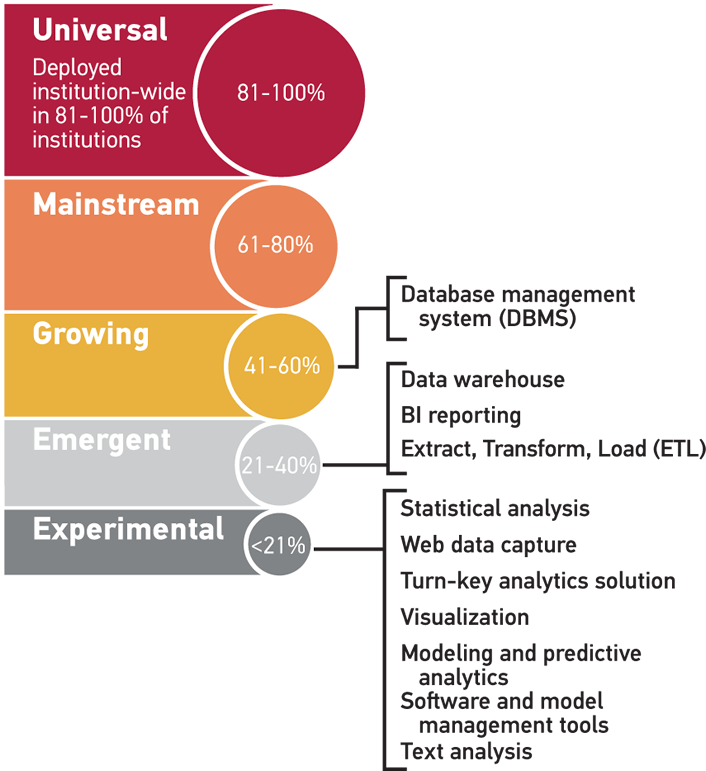
Source: EDUCAUSE Core Data Service, 2015.
Figure 4. Analytics Deployment Index
The clustering of the technologies on the lower part of the deployment index scale is quite telling; institution-wide deployment of technologies that support analytics are more commonly the exception than the rule. Most of the technologies that support analytics are considered experimental, with fewer than 21% of institutions reporting institution-wide deployment. When “targeted deployment” of technologies is added to “institution-wide deployment,” four items migrate to mainstream status: database management system, data warehouse, BI reporting, and statistical analysis.
Moving from experimental to mainstream (to universal) will require significant investment in the resources that support (or grow) analytics capabilities in higher education. This provides a blue-ocean opportunity to bring affordable, quality analytics tools and technology products to market. Learning analytics is a major priority at about half as many institutions as institutional (business) analytics, so investing in the technologies and tools that support institutional analytics will likely precede investment in learning analytics (see the “Shared Investments and Shared Success” sidebar). With sufficient funding levels for analytics hitting 2.9 out of 5 in the analytics maturity index, analytics leaders need to assess the value proposition of such tools and technologies and communicate the return on investment to campus leaders. Currently, low investment/resources scores from the analytics maturity index conceptually validate the deployment index findings. Greater investment will likely beget more of the technologies and tools that can mature institutional analytics capabilities.
Shared Investments and Shared Success
Institutional interests in optimizing business practices and operational efficiencies are driving analytics maturity in higher education more than interests in improving student outcomes. However, it is important to note that these drivers are not necessarily mutually exclusive. Improving student retention, reducing students’ time to degree, and improving student course-level performance (and therefore reducing remediation or dropout) are good business practices that also directly support student success. The lines between institutional analytics and learning analytics blur in these areas. Regardless of the motivation to invest in these factors, the return on that investment will be seen by those interested in improving the business model and by those interested in improving student outcomes.
Institutions won’t likely find a “quick win” when it comes to learning analytics investments since measuring success metrics for student outcomes requires end-of-course, end-of-term, end-of-year, or end-of-matriculation assessment periods. Chief business officers (CBOs), CAOs, CIOs, and institutional research professionals, however, will enjoy the shared success of the initial investment in these areas.
Source: Ronald Yanosky, with Pam Arroway, The Analytics Landscape in Higher Education, 2015 (Louisville, CO: ECAR, 2015), 10.
ECAR’s strategic technology research gives a sense of the types of technologies that institutions will invest in over the next five years.12 Both business performance analytics and learning analytics top the list, with business analytics having greater velocity than learning analytics when it comes to adoption trends (see figure 5). Five years from now, higher education will still be growing capacity to collect and use data for predictive analytics. Mobile apps and on-the-go dashboards will still be emergent. Using “big data” for either institutional or learning analytics will also still be emergent. In five years, higher education will probably have a handle on using data, statistical analysis, and explanatory models to gain insight and act on complex issues (most of the components featured in the definition of analytics). We will most likely still be developing and working on incorporating predictive modeling (the other component of the definition of analytics) to our business practices.
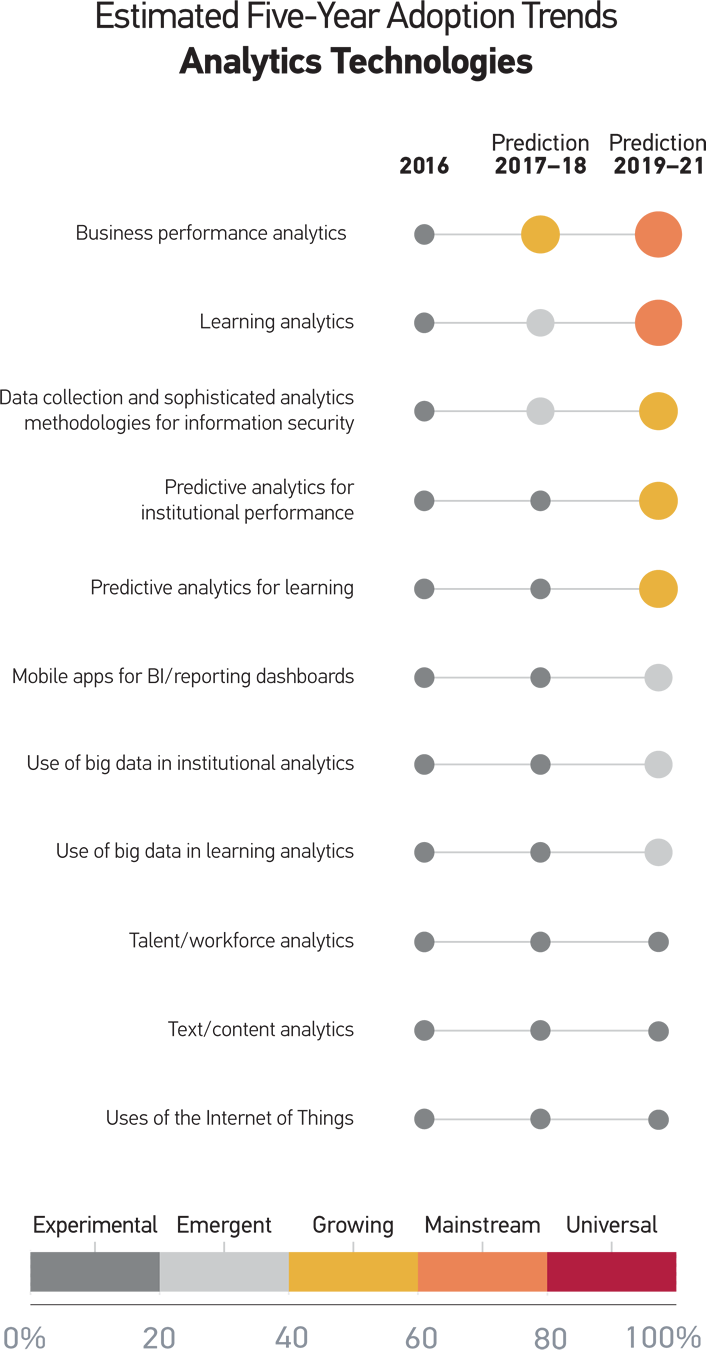
Source: Susan Grajek, Higher Education’s Top 10 Strategic Technologies for 2016, research report (Louisville, CO: ECAR, January 2016), 38.
Figure 5. Estimated Five-Year Adoption Trends for Analytics Technologies
Advice for Moving the Red Queen Forward
Maturing the analytics capabilities at an individual institution is a function of the interaction of the institution’s interests, priorities, and investments with the local conditions that hinder or foster progress toward a goal. The 2015 ECAR research study offers the following advice for moving the institution’s analytics Red Queen forward.
IR Involvement
Creating an analytics program to enhance decision making across an institution is a collaborative effort. In 43% of the institutions surveyed, responsibility for analytics services is shared by IT and IR. For another 27% of institutions, responsibility for analytics is on IR. Cultivating effective communication between IT and IR departments is essential to building analytics maturity. “IR teams already know how to use data to support external reporting requirements. It might be possible to take advantage of the existing analytics staff skill sets and tools to focus on internal problems, as well, or at least to inform analytics strategy setting.” Having a senior-level IR lead involved in the planning for high-level strategic initiatives or questions is also a factor in maturing an analytics program or service.
Technical Infrastructure
Basic technology elements that support analytics are widely available and are relatively up to date. BI tools were reported in place at 86% of CDS 2014 institutions, and data warehouses were in place at 77%. Almost three-quarters of institutions had both. Having analytics tools and software with the capacity to store, manage, connect, analyze, and interact with stakeholders is a sign of analytics maturity.
Decision-Making Culture
We mentioned earlier that institutions tend to view their analytics culture positively, though the feeling is hardly unanimous: A bare majority (53%) of CDS 2014 respondents agreed that their culture overall accepts the use of data to make decisions. Only about a third agree, however, that they have a process for moving from what data say to making changes or decisions. Strengthening change-management practices and incorporating data review formally into decision-making processes could help boost this crucial ability to act. This majority substantially exceeds, however, the 32% who agreed that faculty largely accept the use of analytics. If that sounds familiar, be sure to regularly take the pulse of the faculty community’s willingness to use data to make decisions. EDUCAUSE research shows that the strongest motivator to get faculty to incorporate technology into teaching is evidence that students benefit; the same might hold for receptivity to analytics. Identify pockets of individuals who are unconvinced and target examples to questions or problems that directly affect them.
Policies
This is another area where institutions tend to rate themselves positively, but weaknesses here tend to derive from inadequate policies and practices in information security and in institutional review boards. Fortifying policies in these areas is an essential step toward analytics maturity. Consider creating mechanisms to communicate analytics plans, goals, and achievements to major constituents. As one focus group member put it, “Success is really just trust.”
Data Efficacy
Institutions rate themselves low on data standardization, especially in support of external comparisons, and on processes for weeding out reports that no longer have value. To address such issues, work on improving data standardization; develop processes to eliminate, phase out, or update data and reports that are no longer valuable; and enhance user access to data with self-service tools like dashboards or portals. . . . Focus group members emphasized the need to identify all those who touch, view, or use data and to train them in the practices of good data stewardship.
Investment/Resources
It doesn’t take long to understand why this dimension is the laggard. Only one in five institutions agreed that it has sufficient funding to meet current needs, and a dismal 13% said they have an appropriate number of data analysts. Facile advice to “get more money” isn’t appropriate here, but it is necessary to face the fact that analytics can accomplish only so much without appropriate investment. Make the case for investment by using analytics on itself: Demonstrate through examples, even if of limited scope, that analytics is an investment with real potential for return. Chronically constrained resources make it all the more important to be sure that the analyst workforce is trained in the right skills and that their duties are prioritized to favor the most important tasks.13
The study continues by making the following eight recommendations:
- Define strategic needs and priorities.
- Know where you stand.
- Build the case for investment.
- Think about the whole mission.
- Provide analytics leadership.
- Embrace collaboration.
- Develop people and skills before tools.
- Educate yourself about analytics trends.14
Finally, institutional leaders should also look to the challenges and successes of their peers’ experiences with analytics initiatives.15 They should find ways to learn from these challenges and to adapt or improve on these successes in the context of their own institutions. As an institution builds a capacity for analytics, its comprehension of the possibilities offered by analytics solutions will improve. In turn, this will increase the institutional appetite for easy-to-access, easy-to-understand, relevant, and accurate data to inform decisions.
Not Waiting for Godot
Carroll’s storyline about moving the Red Queen forward in Through the Looking-Glass is a dramatic metaphor for the lack of marked progress in higher education analytics maturity over the past few years. Although individual institutions are making strides, the replicability and the scalability of these successes have yet to permeate across our campuses. Still, at least we aren’t waiting for (the never-to-arrive) Godot when it comes to analytics.16 The centrality of analytics will ensure that the analytics discussion continues over the next few years. “The forces driving analytics interest remain potent: pressure to find new students, meet accreditation requirements, respond to performance-based funding formulas, improve student success, and take advantage of a gusher of educational ‘big data.’”17
Gone are the days of basing decisions on information generated exclusively from human advisors; we are approaching the era of analytics-driven, machine-generated advisory services supported by coders/programmers on the back end and by human storytellers on the front end. As higher education makes this transition, we will need to be cognizant of the relationship between strategy and culture as it pertains to using data to inform decisions. The strategy is to make the best-possible decision using the best-possible information — few will disagree with this until it comes time to change behaviors or practices. Management consultant Peter Drucker is credited with the statement “culture eats strategy for breakfast” — a statement that Vala Afshar, Chief Digital Evangelist at Salesforce, pointedly adapted to: “Culture takes strategy to lunch, has a wonderful conversation, and picks up the check. Culture and strategy are friends.”18 A savvy analytics leader will understand how to frame analytics investment in such a way that culture and strategy are friends, not foes.
This leader will also be able to translate the benefits of analytics for a nontechnical stakeholder audience, will serve as a mediator between those with technical expertise and practical business needs, and will communicate a shared vision that can be used to influence and persuade the institution’s decision makers.19 With analytics leadership, institutions will be able to move the Red Queen forward — increasing their capabilities across the six dimensions of the analytics maturity index — without having to run twice as fast.
Notes
- Lewis Carroll, Through the Looking-Glass, and What Alice Found There (1871; London: Oxford University Press, 1971).
- Jacqueline Bichsel, Analytics in Higher Education: Benefits, Barriers, Progress, and Recommendations (Louisville, CO: ECAR, 2012).
- These six dimensions vary from the original five used in the 2012 maturity index. This second-generation model adjusts the dimension names and contributing factors to better align with institutional practices. This updated analytics maturity model is part of the EDUCAUSE Benchmarking Service launched in January 2016.
- Bichsel, Analytics in Higher Education.
- The audience and instrument can vary from year to year, so we don’t go as far as to say that not much progress has been made within institutions. The maturity index composite scores are best used as benchmarks for the industry overall rather than as self-improvement or peer-comparison benchmarks.
- The mean maturity score for IR involvement increased from 3.7 to 3.8 — a minor and not statistically significant increase.
- Ronald Yanosky, with Pam Arroway, The Analytics Landscape in Higher Education, 2015 (Louisville, CO: ECAR, 2015), 4.
- Ibid., 10.
- Bichsel, Analytics in Higher Education, 8; Yanosky and Arroway, The Analytics Landscape in Higher Education, 7.
- Yanosky and Arroway, The Analytics Landscape in Higher Education, 19.
- EDUCAUSE Core Data Service, 2015.
- Susan Grajek, Higher Education’s Top 10 Strategic Technologies for 2016, research report (Louisville, CO: ECAR, January 2016).
- These six paragraphs were excerpted from Yanosky and Arroway, The Analytics Landscape in Higher Education, 26–29.
- Ibid., 30–31. Expanded details for each recommendation are available in the report.
- See Leah Lang, “Next-Level Benchmarking: How Do You Measure Up?” EDUCAUSE Review, June 13, 2016.
- In Samuel Beckett’s play Waiting for Godot, two characters wait, in vain, for someone named Godot. Conceptual credit for the Godot reference goes to Vince Kellen, CIO at UC San Diego.
- Yanosky and Arroway, The Analytics Landscape in Higher Education, 5.
- Vala Afshar (@ValaAfshar), July 10, 2013, 12:34 PM, Tweet.
- See Technology in Higher Education: Defining the Strategic Leader research report (Bristol, UK, and Louisville, CO: Jisc and EDUCAUSE, 2015).
Eden Dahlstrom ([email protected]) is Chief Research Officer for the Data, Research, and Analytics (DRA) unit at EDUCAUSE.
© 2016 Eden Dahlstrom. The text of this article is licensed under the Creative Commons Attribution-NonCommercial-NoDerivatives 4.0 International License.
EDUCAUSE Review 51, no. 5 (September/October2016)