
Key Takeaways
-
An advanced analytics platform helps prepare your institution for the volume, variety, and velocity of data coming your way.
-
Tremendous opportunities exist from using nontraditional data sources to find new ways to advance student success and institutional performance.
-
The ability to deliver analytic services in the public cloud will force the rethinking of current or future on-premises solutions because of the potential flexibility and innovation offered.
-
While data scientist is the hot new job title, the rest of the institution's analytics workforce must develop and strengthen their skills and technology tools to engage, evaluate, and leverage these new, impending, and inevitable analytics platforms.
The business intelligence (BI) architectures of the 1990s and early 2000s are aging, and the days of a data warehouse–only solution have faded. Historically, the ETL (Extract, Transform, Load) process served institutions well, providing data in enriched table formats or star schema designs that aligned closely with reporting requirements. However, new advanced analytic platforms must support an unlimited number of new data sources beyond our relatively simple structured database data — including real-time data feeds and varied data sets derived from current efforts to instrument the planet, which many know as the Internet of Things. By default, they must ingest data at a greatly accelerated rate. This moves us from an ETL process to an ELT (Extract, Load, Transform) process. Basically, the platform must ingest and store the data now, and digest and organize it later. Prioritizing data gathering and deferring data cleansing and transformation also enables institutions to ask and answer questions never imagined at the time of data collection.
Arizona State University (ASU) has begun to address the onrushing flood of data and the need to store and analyze it to serve the university's mission. Here we explain how.
About Arizona State University
Established in 1885 as a normal (teaching) school with 33 students, ASU today is one of the largest public research universities in the country. With more than 98,137 students enrolled as of fall 2016, 25,722 of them in ASU Online, it is also home to one of the fastest growing research enterprises in the United States and has been named as the most innovative university in the country by US News & World Report for the past two years in a row.
Examples of those innovations include ASU's partnership with Starbucks, which enables all employees to earn a college degree, while the university's Global Freshman Academy, a partnership between ASU and edX, allows students anywhere to successfully complete freshman courses before applying (or paying) for credit. ASU also joined with King's College London and UNSW Australia to form the PLuS Alliance, which has the goal of finding research-based solutions to meet developing nations' education challenges. And ASU is a member of the University Innovation Alliance, a partnership between 11 public institutions to advance student success through investments in innovative processes, technologies, and solutions. The use of data analytics at ASU suggests opportunities, guides decision making, and helps us evaluate results for all of the university's initiatives.
Big Data to the Rescue!
ASU is answering the growing demand for analytics and big data by adding a "data lake" to its BI architecture. A complement to the data warehouse, the data lake is a repository for large quantities and varieties of data. Built on Hadoop, this collection of applications provides a framework to add new and varied data sources and make them available quickly. The value of data lakes is likely to escalate with the growth of the Internet of Things (IoT), as they swell with data from countless networked objects. The expansion of data lakes puts increased importance on data governance controls to manage this new data and ensure appropriate access and authorization.
An advanced analytics platform will also expand analytics capabilities in the future. Traditional BI's primary focus was current and historical data; in contrast, an advanced analytics platform will better enable big data modeling and forecasting, conducting what-if analyses to predict the effects of potential changes in business strategies. The new capabilities will include better predictive analytics, data visualization (figure 1), data mining, big data consumption, machine learning, optimization, simulation, location intelligence, and services beyond the traditional data warehouse and BI tools. The results can translate into improved institutional performance in many ways: optimized building maintenance plans; the ability to predict and prevent system failures; improved utilization of energy and physical resources (sustainability); enhanced service offerings to students, faculty, staff, and visitors; the increased ability to deliver a highly personalized educational experience for every student; and, ultimately, the potential to significantly improve student outcomes.
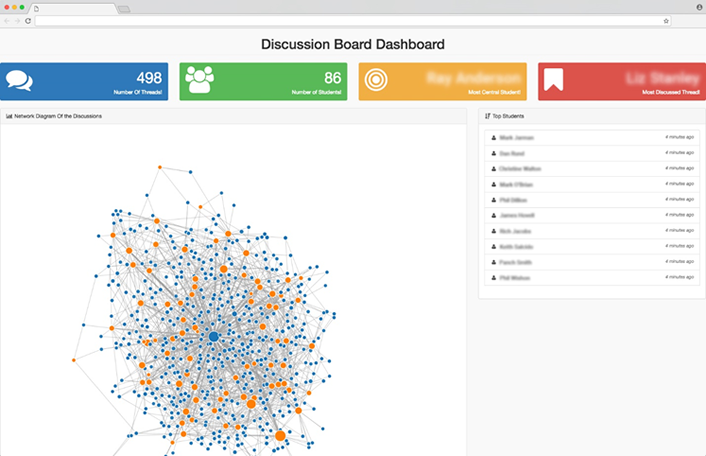
Figure 1. Data visualization for discussion board activity
Data Sources Galore
Past analytics have focused on structured data — data with a high degree of organization — primarily from relational databases such as Oracle or Microsoft SQL Server in enterprise resource planning (ERP) or customer relationship management (CRM) systems. Unstructured data is experiencing explosive growth, currently making up over 80 percent of an institution's data. Examples of such unstructured data (or semi-structured data) that ASU is exploring come from social media (Twitter, Facebook, Instagram), help center chats or calls converted to texts, surveys, e-mails, documents, scientific and research data, learning management system (LMS) discussion boards (see figure 1), videos, audio, digital images, network traffic, web logs, machine/device output, and streaming data from sensors increasingly placed throughout our environment. The goal is to support all these varied data types, assuming the data has reporting or analytical value.
In addition to raw text, much of this structured/semi-structured data is being delivered in the form of JavaScript Object Notation (JSON) or Extensible Markup Language (XML). These new file types introduce complexity into the process, and new skills are needed to ingest, decipher, and create structures to load this data. Meanwhile, advanced programming interfaces (APIs) are replacing database connectors in the extraction of data and will require fundamental process changes to automate its loading.
Analysts now use new techniques and methods with this new foundation of data. Popular examples include sentiment analysis, keyword identification, n-grams creation (number of times a word or multiple word strings appear in a text), and topic modeling (finding hidden semantic structures). Some preprocessing of this data might also need to occur; it might be necessary to spell-check and correct words, standardize the case (upper, lower, mixed), and identify net-centric words or slang (OMG, LOL, ugh, etc.). An example of our use of sentiment analysis appears in figure 2. Tweets referencing ASU Wi-Fi receive a sentiment score based on the content. In this example, negative tweets are flagged and directed to the ASU Help Center, which can then respond to the student's concerns within a matter of minutes. This type of data collection and use offers a powerful tool for an institution to improve services and protect brand image.
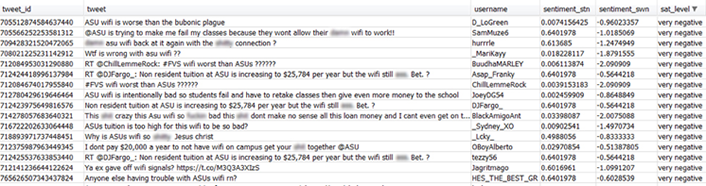
Figure 2. Identifying negative tweets about ASU Wi-Fi using a sentiment engine
Head in the (Public) Cloud
Institutions face significant challenges modernizing existing analytics platforms in addition to maintaining and refreshing their existing IT and BI infrastructures. The onslaught of big data (and an institution's appetite for it) coupled with the speed of new technology and innovation creates ongoing pressure to rapidly adapt and deliver. Flexibility, scalability, reliability, elasticity, agility, security, and cost efficiencies make these cloud environments attractive. Initially, the cloud can offer the ability to test analytic services and systems, much like a consumer test drives a car before purchase, without a huge commitment of resources. This translates into almost zero capital expenditure for initial evaluation of new analytic technology and services (big data technology, machine learning, columnar databases, etc.), which frees up BI and IT teams to test progressive and innovative approaches with greatly reduced risk.
ASU already partners with the major public cloud vendors (Amazon AWS, Microsoft Azure, Google, and Century Link) and continues to look for new entries in the field. The cloud services most aligned with BI include data warehousing platforms, BI tools, storage, Hadoop, data movement, data cataloging, machine learning, streaming data, search, analytic APIs, IoT, and artificial intelligence. Part of this process includes deciding on the deployment option, whether infrastructure-as-a-service (IAAS), platform-as-a-service (PAAS), or, if available, software-as-a-service (SAAS).
Institutions planning to move to the cloud must consider and address several concerns, the most common of which are data privacy and security requirements, connectivity and bandwidth capacity, loss of control, and unexpected costs. These issues require due diligence reviews before making a final decision. However, the promise of speed/compressed development cycles, flexibility, scalability, improved institutional agility, and faster time-to-market is hard to ignore and will force the rethinking of current or future on-premises solutions.
Preparing the Analytics Workforce
Enabling and continuously improving the data-driven institution requires analysts to build and grow skills and capability as well as technology tools. While "Data Scientist" is today's hot new title, merging the skills of statistics, mathematics, programming, communication, and business knowledge, these multidisciplinary individuals are rare as well as in very high demand. Meanwhile, many other vital analytics roles exist (see table 1). Soft skills like communication and collaboration must not be ignored in favor of obvious requirements in data analysis, domain expertise, data visualization, and reporting/dashboard development at all levels of the analytics workforce.
Table 1. Skills and technologies needed for analytics roles
|
Analytics Role |
Skills/Capability |
Technology |
|---|---|---|
|
BI analysts |
Data analysis/domain expertise, communication/collaboration, visualization |
SQL, BI tools, Python |
|
ETL analysts |
Programming, data integration, data warehousing |
SQL, Python, Hadoop/HDFS |
|
Institutional researchers |
Data analysis/domain expertise, modeling, communication/collaboration |
SAS/SPSS, BI tools, SQL |
|
Statisticians |
Modeling, algorithms, prediction |
SAS/SPSS, R, SQL |
|
Data scientists |
Modeling, machine learning/data mining, communication/collaboration |
Hadoop/HDFS, R, Python |
|
Business user |
Communication/collaboration, spreadsheets, reporting/dashboards |
BI tools, SQL, Excel |
In an inventory of analytics technologies, several are emerging as leaders in the BI tool space. Python, a general-purpose programming language created in the late 1980s, is becoming a widely adopted, versatile, and relatively easy to master programming language standard for analyzing, prototyping, and visualizing data. R is gaining adoption for statistical computing and graphics. Nonetheless, SQL (Structured Query Language) remains the dominant technology in analytics, a common language that interacts with relational databases and is the bedrock for fetching data from a data warehouse.
Lessons Learned at ASU
We have found data lakes a promising option for "flood control" of the tsunami of data soon to be hitting higher education. In this article we advocate for a move from an ETL (Extract Transform and Load) to an ELT (Extract Load and Transform) process, with a broad-spectrum approach to capturing data. ASU's planned advanced analytics platform, shown in figure 3, positions the institution with a forward-looking environment to handle the deluge of data already here and what we see coming. This environment not only supports traditional structure data sources like relational databases from enterprise systems, but new sources of data that include unstructured and semi-structured data. In addition, the new environment supports nightly data loads (24-hour-old data) and streaming/near real-time data, and multiple ways to ingest, consolidate, and store all this data. This new platform can shorten the data discovery lifecycle, opening an larger set of tools for analyzing and mining our big data, leading to new and faster discoveries.
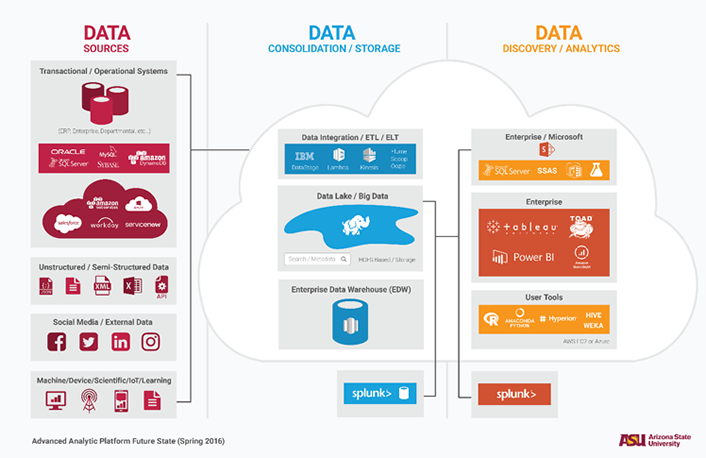
Figure 3. Advanced analytics platform plan
As noted, public cloud services offer an excellent way for institutions to test analytic offerings with low implementation costs, and we highly recommend testing this approach. However, it is important to balance out positives, such as the ability to quickly add new data sources, provide faster insights, and offer real-time analytics, with valid concerns about data privacy, security, capacity, and control.
Remember, finally, that all the raw data and analytics technologies in the world are useless without skilled and committed analysts to gather, maintain, and interpret data. The institution's analytics workforce must develop and strengthen their skills and technology tools to engage, evaluate, and implement these new, impending, and inevitable analytics platforms with all their promise. The current BI environment demands analysts who can command a variety of interpersonal and technical skills, including conversance with emerging analytics technologies.
ASU is poised to benefit with this advanced analytics platform and is already experiencing improvements in terms of the speed with which we can get this data into our customer's hands and providing a broader selection of tools. Network, marketing, research, and learning/academic data lends itself nicely to this environment and is on the roadmap to developing inventive and innovative usages of this data.
Meanwhile, knowledgeable staff, public cloud offerings, and flexibility in learning and adopting advanced analytics platforms strengthen any higher education institution's ability to understand and put its data to work in supporting its financial health and ultimate mission of educating students.
Gordon Wishon is CIO at Arizona State University.
John Rome is deputy CIO and BI strategist at Arizona State University.
© 2016 Gordon Wishon and John Rome. The text of this article is licensed under Creative Commons BY-NC-SA 4.0.