
Key Takeaways
- Lead by its CIO, the Saint Michael's College team created a simple biweekly dashboard that many other institutions can replicate using their existing tools.
- The dashboard report consolidates reporting functions for key measures that are critical to operational and tactical success.
- Anecdotal evidence — including an initial skeptic who now champions the system — suggests that the system is used and highly valued among the target group and that its use is spreading to other groups on campus.
Approximately five years ago, Saint Michael's College faced significant reporting challenges among members of the president's cabinet and relevant committees; these challenges included too many reports and authors, inconsistent data definitions, a lack of systematic updates, poor coordination of key measures, and haphazard sharing of reports and updates. As a result, many decisions were made by gut feel or at best using anecdotal evidence because reliable data were either outdated or simply unavailable. Although we sensed a need for more data-informed decision making, we lacked a crisis to inspire innovation. Soon, an unexpected and material variance in our incoming class enrollment and financial aid targets provided the needed spark.
A cross-functional team led by CIO William Anderson ultimately created a simple biweekly dashboard report to consolidate and standardize reporting functions for key measures that are critical to operational and tactical success (figure 1). We also built several new higher-level benchmarking measures (key performance indicators) that address more strategic issues.
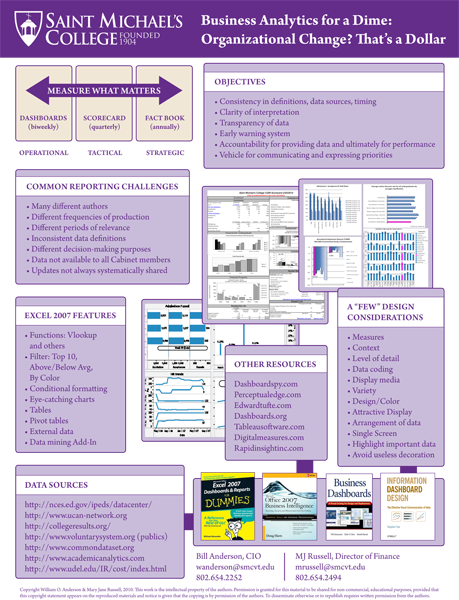
Figure 1. Key measures for operational and tactical success
At the highest level, we crafted a report that expresses and monitors institutional priorities. Our specific objectives included consistency in data definitions, coordinated timing, clarification of data and interpretations, and transparency. We wanted our dashboard to identify leading indicators and to serve as an "early warning" system, but in all honesty a key objective was to create accountability for providing data — and ultimately for improving performance surrounding those key measures. Even today, our efforts continue to evolve, with heightened emphasis on assessment in the academic affairs area and the adoption of new technologies that provide opportunities for efficient data collection and dissemination.
In this presentation authors Bill Anderson and Mary Jane Russell discuss and demo the analytics dashboard (8:40 minutes).
In this presentation authors Bill Anderson and Mary Jane Russell discuss evolutionary analytics (11:02 minutes).
Unexpected Events Prompt Data-Informed Decision Making
Our efforts to move toward data-informed decision making initially began as a response to several unexpected events that had a material impact on our financial statements and operations. Specifically, we had recently experienced a significant variance in our freshman discount rate, a decline in enrollments of certain graduate programs, and a spike in utilities expense, and were concerned about how well our internal position control system was functioning. Later, our efforts grew more thoughtfully in the context of concomitant strategic- and financial-planning processes and the institutional self-study related to our 2010 decennial reaccreditation.
Dashboard Development
At the time our project began, dashboard solutions were expensive and time-consuming to implement. With limited funds and even more limited time, we leveraged the features of Excel 2007 to create a simple dashboard that could be updated and maintained without significant staff training —and no capital outlay. Our dashboard has evolved over time and improved as a result of the new graphics and charting features in Excel 2010.
We researched the design principles outlined by Stephen Few to give our dashboard a crisp, functional look and feel that was a great improvement over most of the commercial dashboard software packages. We initially leveraged low-cost solutions such as Tableau for some data analysis and have recently begun implementing dashboards based on Business Objects and a new reporting solution, Informer to further enhance our reporting capabilities in support of our high-level dashboard. Figure 2 shows the 2006 dashboard prototype; figure 3 is the 2009 dashboard; and figure 4 is a prototype of the dashboard planned for 2013.
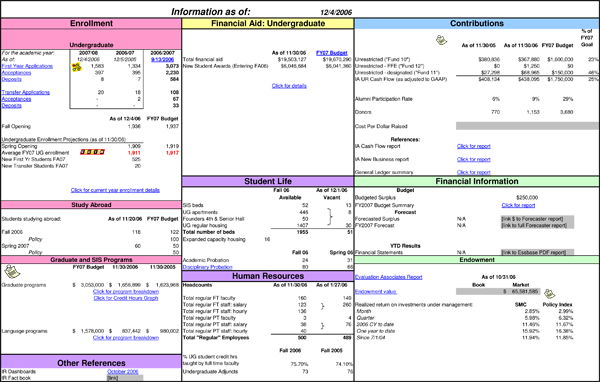
Figure 2. Dashboard prototype from 2006
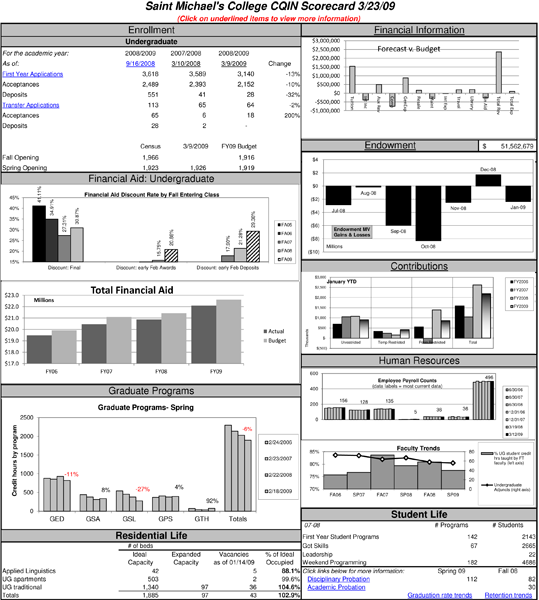
Figure 3. Dashboard from 2009
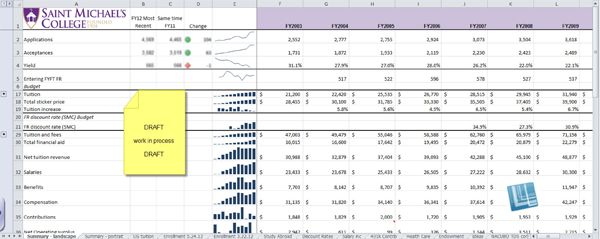
Figure 4. Dashboard prototype for 2013
Challenges: User Involvement, Problem Solving
Our initial challenges were primarily human factors. We sensed reluctance by some stakeholders to share data and/or to provide the most current data to our team. Other potential users were hesitant to engage unless the dashboard could be "actionable" rather than a mere reference. There were also data definition questions to address, which led to productive discussions between the finance and institutional advancement departments and ultimately resulted in several process improvements regarding gift recognition and endowment reporting. Another challenge, amazingly, was clarifying the myriad ways to define a "full-time student." First, however, we focused on the project's organizational change aspects, including sharing, defining, and coordinating data.
When the project started, we were fortunate to be Datatel's invited client at the Continuous Quality Improvement Network (CQIN) summer institute, where that year's theme was breakthrough thinking. There, we learned specific techniques for problem solving developed by the IDEO design firm. Using IDEO's methodology, we first observed the reporting needs and gained a solid understanding of college leadership issues.
We developed prototype dashboards and sought feedback from cabinet members after each version had been in production for a period of time. We used this feedback to refine our next version of the dashboard report, creating a cycle of continuous incremental improvement. These improvements considered the dashboard's visual impact and, more importantly, the quality and applicability of the content itself.
Use and Benefits
Patrick Gallivan, Vice President for Institutional Advancement, talks about the dashboard report's use and value in his work
Team members conducted interviews with vice presidents at several points during the first 18 months of the project, gaining valuable insight into how cabinet members were actually using and benefitting from the project. Both our former and current presidents have embraced the project; in fact, our current president has found the dashboard especially noteworthy because he and others at his former institution had struggled for more than 10 years to create something similar, but never succeeded. Further, the chairman of our board of trustees has asked to receive the biweekly dashboard as well, which has reinvigorated the timely provision of data and stimulated the inclusion of additional measures.
Still, we have not found a valid way to measure our project outcomes. One of our favorite measures is in fact anecdotal — one of the initial naysayers repeatedly cites the dashboard as the authoritative data source when giving important presentations to the trustees and other groups. Our dashboard is also used by people on campus beyond the cabinet. For example, it is a key source of data for the analytical review and analysis of monthly financial statements, and our external auditors reference it in their annual fieldwork.
Jerry Flanagan, Vice President for Admissions and Enrollment, talks about how the dashboard supports his work
The dashboard has filled a gap by providing more timely, tactical data and supplementing our quarterly scorecard and annual fact book. Saint Michael's President Jack Neuhauser notes:
"When I arrived at Saint Michael's I was struck by how well the biweekly dashboard integrated and standardized information from across the college. Of course this could not have been accomplished without substantial redesign of several financial systems and widespread 'buy-in' by many key individuals. Not only have these systems contributed significantly to strategic planning but they provide strong and timely data for operational monitoring."
In combination, these three "pillars" of our business intelligence effort, along with relevant financial reports, provide the right mix to support data-informed decision making on our campus.
Easy Replicability
The reporting challenges faced by Saint Michael's College are certainly not unique, and other small institutions without significant capital budgets or large IT and institutional research staffs are also likely to be facing them. Our simple dashboard can be updated fairly quickly and provided to top management using technology tools that most campuses already own. For example, distribution can be accomplished simply through e-mail and the dashboard also can be provided and archived through network and web-based resources such as shared network drives, SharePoint, and campus portals. Microsoft Excel is a commonly available software package and several books detailing its features and dashboard design are readily available.
Further Reading
Now You See It, by Stephen Few
Information Dashboard Design, by Stephen Few
The Visual Display of Quantitative Information, by Edward R. Tufte
Microsoft Office 2007 Business Intelligence, by Doug Harts
Excel 2007 Dashboards & Reports for Dummies, by Michael Alexander
Business Dashboards, by Nils Rasmussen, Claire Y. Chen, and Manish Bansal
© 2012 William Anderson and Mary Jane Russell. The text of this EDUCAUSE Review Online article (July 2012) is licensed under the Creative Commons Attribution-NonCommercial-NoDerivative Works 3.0 license.