
Key Takeaways
- The legacy reporting system at Portland State University often could not provide the combinations of data sets needed to answer key questions about the university.
- The university launched DataMASTER to create a single organized, accessible repository of data that would foster development of a culture of data-driven decision making.
- An increased need for transparency demanded that information silos be removed and that a culture of data stewardship replace a culture of data ownership.
Like many organizations, Portland State University (PSU) found itself at a crossroads where data-driven decision making is essential to remain competitive and financially sound in an environment with increasing costs and decreasing state funding. In late summer 2009, PSU needed to answer several key questions regarding university resources, student success, and budget models. Staff quickly became frustrated with their inability to confidently answer these questions. The legacy reporting was cumbersome and often did not provide the needed combinations of data sets (for example, student and finance, or student and human resources).
Vice President Monica Rimai describes the project rationale
To meet business intelligence needs, Portland State launched the DataMASTER Project (Management and Analytics for Strategic, Timely, Education Reporting) in fall 2009. DataMASTER created a single organized, accessible repository of data that would facilitate the development of a strong, systemic culture of data-driven decision making.
Two years into the project, the project team discovered the need to adjust our priorities and approach. This case study provides a frank discussion of successes and failures on a journey to business intelligence.
Legacy Reporting System
The PSU legacy reporting environment was a disconnected collection of data and reports from multiple disparate sources that were manipulated using a wide variety of tools. Daily ERP snapshots were provided in a data store, but data models had not been fully developed. Faculty and staff had locally installed client software used to develop and store custom queries and reports. Data extracts were also loaded into numerous spreadsheets and other data manipulation tools. This often led to “multiple versions of the truth” and did not exactly inspire confidence in decision making. If the data did not feel right, it might be ignored in favor of anecdotal analysis or gut feeling.
In many cases, the necessary data simply didn’t exist in a reportable format or local department custom, or business process, prevented the sharing of data. Consultants noted that there were many “shadow systems” (e.g., MS Excel spreadsheets, FileMaker Pro databases, MS SQL) that resulted in redundant work, errors, and out-of-sync conditions. Additionally, existing processes, structures, and supportive information technology were not adequately aligned or scalable to support PSU’s desired growth. The consultants specifically recommended:
- Deploying enterprise-wide systems that effectively support the university
- Improving and integrating related processes
- Eliminating shadow systems, paper, and duplicate data entry
- Clarifying roles and providing expanded training
- Simplifying and standardizing processes
To succeed, the PSU community had to engage in a large-scale solution deployment and significant business process change. An increased need for transparency demanded that information silos be removed and a culture of data stewardship replace a culture of data ownership. Ensuring “a single version of the truth” required standardized reporting environments.
The basic vision of DataMASTER is to make information at PSU more accessible and easier to use. The assumption was that if faculty and staff can get data easily, they will spend less time gathering information and more time analyzing it. Having data from several different sources promulgated through an Extract Transform and Load (ETL) process allows us to easily create robust data models and reporting environments in new and creative ways.
To easily explain the depth and breadth of the project, I developed an image depicting a six-step journey to business intelligence (figure 1). The steps include building a broad base of users, knowledgeable about our data sets, using consistent data element definitions. These users then learn how to use the appropriate tools to run the pertinent reports. The next stage involves the automated creation and distribution of reports. With the first three steps in place, data analysis can then inform business process reengineering. Ultimately, this all becomes operationalized as a core part of the organization, leading to optimization of all decisions in a consistent and accurate manner.
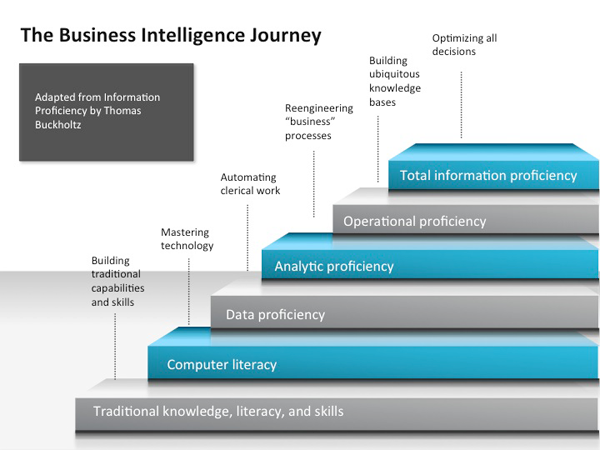
Figure 1. The six-step journey to business intelligence
PSU confronted two immediate issues to move the DataMASTER project forward and realize our goal of becoming a data-driven decision-making university. The first issue concerned the need to identify and fully implement tools that allow for the extraction, organization, and analysis of data from PSU enterprise data sources. The second issue concerned the institutional commitment to change business practices so that data can be collected and reported in a coherent, consistent, and logical fashion. To mitigate these issues, the project team adopted several core objectives for DataMASTER:
- Collaborate through effective communication
- Reconcile term definitions
- Align information needs with management and university goals
- Ensure data is accessible to people having a wide range of technical abilities
- Empower users through the use of appropriate technology
- Foster education on the complexities of business intelligence
The team also felt strongly about employing guiding principles to influence decisions and direction while planning and delivering the solution. Transparent data access and delivery were deemed key to project success. We immediately developed a public project site that showed exactly what was being developed and for whom. We acknowledged that business intelligence was new to us and that our priorities and assumptions would likely evolve. Thus, the project plan needed to have some flexibility. Finally, it was thought that project governance via broad cross-institutional participation would be critical. The sheer magnitude of the project indicated a need for tremendous human resources, plus, it was thought that having so many people involved in the development of the solution would lead to solution acceptance and adoption.
Solutions Adopted
Business analyst Robert Naranjo discusses the concept of a single source and single version of the truth
DataMASTER is a solution to create a single source of business intelligence focused on “take-action analytics” based on a combination of history and forecasts using the Ellucian Operational Data Store (ODS), Enterprise Data Warehouse (EDW), and IBM TM1 and Cognos reporting and business intelligence solutions. Through this initiative, PSU has a single source of reliable data. The solution provides a user-friendly solution to examine historical, benchmark, and forecast information in order to create a foundation for strategic revenue and expense management strategies. The solution also provides a platform for developing bidirectional data feeds with other key enterprise systems such as student housing manager, customer relationship manager, and facilities manager.
Cognos Administrator Alison Nimura provides a brief demo (0:59 minute):
The project governance was initially organized around three core data domain Business Intelligence Reporting Task Teams (BIRTTs) that reported to a Steering Team:
- SBIRTT: Student Focused
- HBIRTT: HR Focused
- FBIRTT: Finance Focused
These teams were large, consisting of a cross-section of campus constituents who had an interest in the outcomes for that functional area. The BIRTTS met frequently over six to eight weeks to identify and record measures and dimensions for reporting data elements in an “information opportunity portfolio.” An SBIRTT example appears in figure 2, with the template used shown in figure 3.
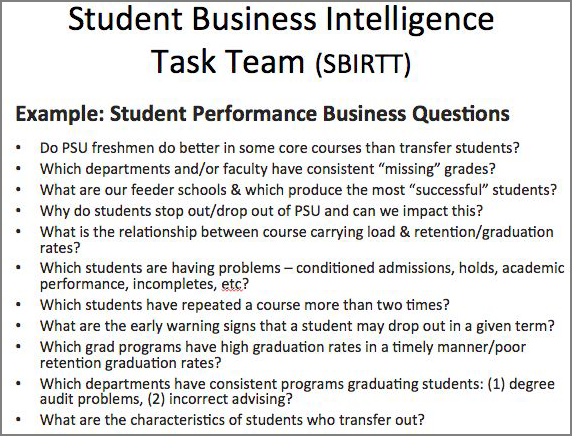
Figure 2. SBIRTT example
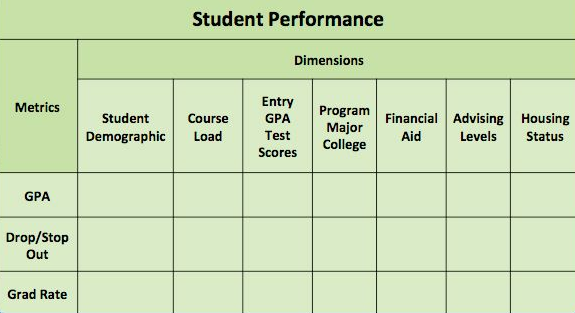
Figure 3. SBIRTT template
BIRTT work resulted in report requests that were handed off to the newly created central business intelligence team for development. This then launched a typical iterative IT development cycle (figure 4).
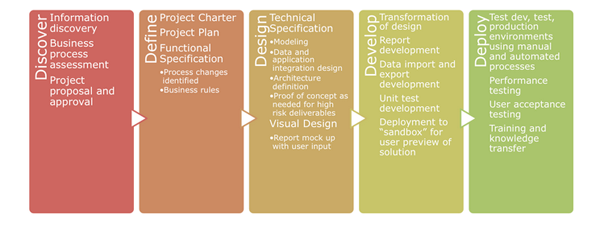
Figure 4. Typical IT development cycle
Unmet Challenges
After two years of intense project work, PSU was less than satisfied with progress. All of the hardware and software had been deployed, numerous project committees had been formed, several information opportunity portfolios had been developed, and several reporting frameworks were in production — but the project team was well short of our goal to fully replace the legacy system with DataMASTER. We found ourselves all the way back at step one of our journey.
The project sponsors at the time (author Sharon Blanton and Monica Rimai) decided to “reset” the project by revamping the project plan, governance, and funding in an effort to alter the course and achieve faster, more meaningful results. Specifically, we gave the project a new project manager, added a vice presidential layer of project governance, and injected cash into the project to provide for additional software licenses and consulting. The new project phase was dubbed DataMASTER2 (DM2).
What Went Wrong, and What Did We Learn?
- Business intelligence projects run by IT tend to fail.
While this project was highly desired and had strategic impact for PSU, it represented a significant change in our processes and thus required substantive changes in practice and behavior to succeed. Gartner research shows that more than 50 percent of all business intelligence initiatives across the industry fail within 18 months. Inconsistent implementations, lack of executive sponsorship, lack of cooperation, and resistance to business process change can cause slow adoption and abandonment of business intelligence projects.
Although Gartner had cautioned us about this, IT had been directed to own the project, so we forged ahead. Our constituents were excited about the possibility of a new reporting tool, but skeptical about our timeline and uncertain how to engage in the project. Although the project wasn’t a complete failure, it definitely stumbled. A project of this scale needs more than one champion, and ultimately it was important for us to reorganize and have the vice presidents (all of them) serve as project sponsors, helping to promote the project. In return, we demonstrated real value to each vice president by clearly documenting deliverables for their areas. This governance change helped to reignite project excitement and engagement.
- Project sponsorship can’t just be in name only.
In some projects, sponsors sit back and wait for monthly project reports and only become engaged if a problem arises. For sustainable success, it is crucial that sponsors have clearly defined roles and responsibilities that keep them engaged in the project and invested in its success. Sponsors should go beyond providing project oversight and problem resolution to truly championing the project through their actions. In this case, it was important for our sponsors to keep on message by continually promoting DataMASTER and the new tool sets.
- Project management must adjust to the customers involved.
Every campus has a unique culture, for better or worse. Trying to change that culture too much, too fast, can end in frustration for all. The highly centralized approach first attempted by the DM1 project did not sit well with the rest of the campus. The hope was that the DM1 project could be used to transform our campus into a more regulated methodology for report generation. We attempted to swing from a highly decentralized, Wild West world of data to a more organized, regulated, and centralized business intelligence office. The harder we tried to enforce this methodology, the more uncomfortable we made our customers.
The solution was found in the middle. We thanked the BIRTTs for their service and explained that we would be regrouping and forming smaller, more focused work teams. We also reached out and created a network of carefully selected Report Authors across campus. The Business Intelligence Team and the extended Report Author Team worked together toward a common goal: a single version of the truth. The smaller teams have worked much more efficiently, producing reports that benefit the entire campus.
Project Manager Ellen Weeks describes the project site and turnaround effort:
- No matter how much customers dislike a legacy system, they will dislike change more.
This is one of those universal truths that every change agent must understand. This was particularly true for the DataMASTER project on two fronts.
- First, the change felt very personal to some customers. The legacy system was extremely difficult to use, therefore many people simply chose not to use it while others developed expertise that made them “go to” resources. In the new model, everyone has direct access to data pertinent to their role. Individuals can easily run predesigned queries. This has felt threatening to the previous power users. It has been essential that they become architects of the new system so that they can actually help create the change rather than have the change thrust upon them.
- Second, the data was hard to reach in the legacy system. In the new system, a base level of data will be provided to everyone. The new level of transparency should yield better decision making and increased efficiencies, but some have enjoyed the role of data gatekeeper and do not welcome the new transparency. It bears repeating that change, even positive or desired, will be difficult.
- Appropriate governance has everything to do with project success.
New governance structures should be carefully considered before foisting them on the campus. Ideally, governance would be designed with buy-in from departments across campus prior to implementation. In our case, we had to disband the BIRTTs and find a leaner solution. The DM2 Project replaced the BIRTTs with smaller, more agile, Work Groups that could be formed and dissolved as needed to address particular business intelligence solutions. For example, an HR Demographics Work Group was created to focus on affirmative action and other employee demographic reporting needs. Legacy reports were used to generate the design of the new reports. This greatly simplified solution worked much better for our culture than the previous lengthy discovery process employed by the BIRTTs. Additionally, we engaged a model of Report Authors (power users), jumpstarting the creation of campus-wide reporting components, with the business intelligence team enhancing them for enterprise deployment.
- Overwhelming process can lead to underwhelming results.
The Information Opportunity Portfolio methodology was sound, but clients grew tired of the lengthy process and project fatigue set in. The workshops resulted in very few new business questions. The clients clearly wanted their “regular” reports and were frustrated that they couldn’t do everything they wanted to in the new environment. They resented having to suffer through a cumbersome discovery process just to request the reports that they already knew they needed. We shifted to an abbreviated process and ran business intelligence and standard reporting workshops simultaneously. This allowed a much broader base of users to get exposed to the tools; they were then more able to develop new business intelligence questions.
- A business intelligence project can foster amazing cross-campus collaboration and knowledge transfer.
The excitement surrounding the DataMASTER project can be contagious — but only after we opened the doors to others did that happen. We extended report authoring tool access to a select group of campus super users within the administrative units (Finance, Budget, HR, Institutional Research, etc.). We then brought this group together with our own IT Report Authors for regular meetings, and the results have been very positive. The group shares expertise, reviews and assigns new report requests, and has recently taken on the huge and sometimes thankless task of creating and maintaining a data dictionary. The HR and Budget teams came together strongly over the issue of position management. Our legacy system examined human resource and budget data separately, but in DataMASTER, for the first time, HR and Budget could develop true position management solutions. Bringing these teams together has resulted in more efficient workflow and more accurate data for everyone.
- A mission-critical project should be managed by someone with deep and broad institutional knowledge and relationships.
When this project launched, we were also in the middle of hiring a new project manager. We knew this project would require full-time attention, so we decided to assign it to the new PM. Although the PM had plenty of time to dedicate to the project, we underestimated the importance of relationships and institutional history. It was difficult for a new person to navigate political landmines and negotiate change without the benefit of institutional knowledge. Ultimately, the PM resigned, and we reassigned the project to a well-known, long-term PSU PM. This resulted in an immediate and sustained productivity boost.
- When creating a new unit to manage and deliver a new service, be sure to build in time for team cohesion, institutional knowledge transfer, and cultural intelligence as part of the project plan.
Anyone who examines our project timeline closely will see that we started building the solution before we had the full team assembled. Over the course of two years, we slowly added a new six-person team. Each new hire jumped into the project at different stages and required significant training. Ideally, we would have hired the whole team, given them time to build relationships and complete training, and then launch the project. When delivering a transformational project, it is essential that the entire team be “shovel ready,” know how to successfully work within the institutional culture, and be invested in the solution.
- New tools expose the need for new policy.
The new tools and reporting framework brought much needed data transparency and more efficient business processes; however, these changes necessitated a new set of policies regarding how to safeguard the data. We faced the familiar battle between data transparency and security. The eBAR system (an electronic Banner Access Request and approval system we developed in Ellucian Workflow) was modified to vet requests for access. A core set of reports was designated as public information and made available to every user.
Real Change Becomes Evident
With two and half years of experience, we are starting to see real change:
- DataMASTER is well known across PSU.
- Users are asking better questions about the data.
- We see increased collaboration throughout the Oregon University System.
- Reports that took weeks to assemble are now run in minutes.
- The implementation of these tools is facilitating our move to performance-based budgeting.
- Increased efficiencies have spawned many business process improvements.
- More than 300 staff are using the new system.
- Reports are now developed in a matter of days instead of weeks.
- The legacy system now has a firm decommission date (December 21, 2012).
- Plans are being made to retire shadow systems.
Affiliated business process improvement projects are launching upgrades to our document imaging and workflow system, human resources recruitment and applicant tracking system, employee onboarding, and budget development and monitoring. Most importantly, we are now seeing some evidence of operating at the third and fourth steps of the business intelligence journey.
Applicability and Replicability
Although every organization may have slightly different goals and institutional cultures, one thing they have in common is that they have either embarked on a business intelligence project or plan to initiate one. At PSU, the journey to business intelligence was deemed critical to the success of the institution and, as such, received significant budgetary and sponsorship support. Even with all of this support, we still stumbled several times throughout the journey. During the project planning phase, significant research was conducted, but much of the research focused on business settings, which clearly have a different mission and culture. If more higher education project roadmaps and discussion had been available, it is possible that DataMASTER would have seen success sooner. To assist others in avoiding similar pitfalls, the DataMASTER project documents are freely available (see the For More Information box). They can easily be modified to fit the needs of other institutions. As a community, higher education has a great opportunity to contribute to the literature around business intelligence best practices.
DataMASTER continues to be a transformative project for Portland State. At its core, DataMASTER started as a project aimed at providing a more consistent, reliable reporting environment to facilitate decision making, but in reality it has taken on a life of its own, bringing increased collaboration across the institution as we slowly break down silos and improve business process. Ultimately, the entire university community will benefit from this strategic journey.
For More Information
Please see the slides from a recent Educause presentation (under the Resources tab) and the DataMASTER2 project site.
Acknowledgments
Many thanks to the key contributors to this article: Ellen Weeks, Project Manager; Alison Nimura, Cognos Administrator; Bob Naranjo, Business Analyst/Report Writer; Brian Grant, Media Production; and Ashley Henderson, Project Coordinator.
© 2012 Sharon Blanton. The text of this EDUCAUSE Review Online article (July 2012) is licensed under the Creative Commons Attribution-Noncommercial-ShareAlike 3.0 license.