
Key Takeaways
- The lack of timely information to identify and prioritize outreach to at-risk students challenged retention and student success efforts at Paul Smith’s College.
- The existing Early Alert program surveying students at four weeks into the semester and analyzing their performance at midterm, was labor intensive and slow, prompting creation of a new Comprehensive Student Support Program using technology including data intelligence and analytics, for more efficient and effective student success interventions.
- The improvements in student success efforts have resulted in increased success, persistence, and graduation rates for all students at Paul Smith’s College.
Paul Smith’s College faced significant retention and student success challenges. In response, a campus-wide taskforce created to examine the problem developed a new Comprehensive Student Support Program. Key to the success of this new effort was identifying and resolving the underlying issues that had prevented progress in previous retention efforts.
We identified several underlying challenges, particularly the lack of timely information to identify and prioritize outreach to at-risk students: The right analyses were not being performed on the right data to allow the right people to identify and reach out to the right students at the right time. Without the resources to collect more data, the only viable solution seemed to be increasing the efficiency and effectiveness of our analytic capabilities using our current data.
Serving a High-Need Population
A small, private, nonprofit college, Paul Smith’s serves a high-need population, with 43 percent of incoming students in fall 2011 eligible for Pell grants, 51 percent first-generation college students, and 47 percent graduating in the bottom half of their high school class. A large percentage of these high-risk students are academically underprepared and unequipped to handle the rigor and pace of college courses. Thus, our challenge is to identify the most at-risk students as early as possible to allow for effective outreach to support their success along the path to graduation.
Prior to implementation of the Comprehensive Student Support Program, we used an Early Alert program at four weeks and midterm grades at eight weeks to identify at-risk students. Both of these processes were labor intensive, and actionable information was often not available to the support offices in a timely fashion so that they could prioritize and reach out to at-risk students.
Solutions Adopted
As a small college with very limited institutional research capabilities, increasing our efficiency and effectiveness through technology and automation was critical to the success of our Comprehensive Student Support Program. Paul Smith’s implemented two technological solutions to solve our information problems: (1) Rapid Insight’s Veera and Analytics programs, and (2) Starfish Retention Solutions EARLY ALERT and CONNECT programs.
First, Rapid Insight’s Veera, a data intelligence program, and Analytics, a statistical and predictive modeling program, allow us to:
- Combine different file types and data formats into a single file for analysis
- Automate routine reports and analyses
- Use predictive modeling to identify at-risk students prior to their enrollment
- Automate the distribution of the results to those who need them
Second, the Starfish EARLY ALERT and CONNECT technologies allow us to:
- Automate much of our data collection
- Use analytics to increase our identification of at-risk students
- Automate the process to prioritize students for intervention and outreach
- Automate communications with the support offices, students, and faculty in real time
Challenges and Resolutions
Paul Smith’s College faced two major challenges: identifying at-risk students early enough to intervene successfully, and automation of our processes to increase their efficiency.
Challenge 1: Early Identification of At-Risk Students
The right students must be identified and an intervention carried out at the right time to achieve the right result. The technology solutions we implemented allow us to address this challenge in the following ways:
- With predictive modeling, we can predict students’ end-of-first-semester GPA and target at-risk students for outreach from our success counselors prior to the first day of class.
- Analysis of our Noel Levitz College Student Inventory (CSI) data identifies a subgroup of high-risk students and again allows us to intervene with these students prior to the start of the semester.
- Starfish EARLY ALERT allows for identification of at-risk students in real time during the semester and automatically prioritizes students for outreach, improving the effectiveness of outreach and the efficient use of staff time.
Challenge 2: Automation to Increase Efficiency
The right information must be received by the right people at the right time to improve student success.
- Routine reports and analyses are automatically run and distributed by e-mail through Rapid Insight’s Veera program.
- Starfish EARLY ALERT allows for automated communication of “flags” or concerns to students, faculty, and support staff and automatically closes the communications loop when a concern is addressed.
- Starfish EARLY ALERT automatically prioritizes newly identified at-risk students for outreach and e-mails the support offices.
- Reports generated from Starfish EARLY ALERT allow identification of high-challenge courses, resulting in prioritization of tutoring and other academic support resources.
The design of an Early Alert flag plan is critical for automatic prioritization of students for intervention and for ease of use by faculty and support offices.
In the following video author Loralyn Taylor describes how Paul Smith’s College has designed a clear and effective Early Alert Flag Plan (6:40 minutes):
In this video author Loralyn Taylor discusses the Comprehensive Student Support Program focusing on the use of targeted analytics to identify at-risk students (4:51 minutes):
While our faculty were committed to conducting the four-week survey and submitting midterm grades, for many students this is too late to intervene and have a positive impact on an at-risk student’s academic success. It became clear that we needed to identify and intervene with these at-risk students as early as possible. The following examples illustrate how the college uses targeted analytics to improve the effectiveness of the Comprehensive Student Support Program.
Targeted Analytics Example 1
Predictive modeling to identify high-risk students prior to the start of the fall 2010 semester identified 99 students who were predicted to earn a first-semester GPA below 2.00. In response, we raised a high-risk warning flag in our Starfish EARLY ALERT system and targeted those students for early intervention and outreach. Despite intensive academic counseling with 44 of these high-risk students, only 36 percent achieved good academic standing (GPA over 2.00) compared to 77 percent of the students predicted to achieve good academic standing. In addition, students identified as high risk also had lower average GPAs and higher rates of probation and withdrawal (table 1).
Table 1. Performance of High- and Low-Risk Students Identified by Predictive Models
| First-Time Students | Low Risk | High Risk | Increase or Decrease |
|---|---|---|---|
| Withdrew | 3% | 8% | 167% |
| Ended term on probation | 10% | 38% | 280% |
| Ended term in good standing | 84% | 45% | −46% |
| Average GPA | 2.87 | 1.78 | −38% |
Targeted Analytics Example 2
Analyzing the results of our Noel Levitz CSI, we found that students scoring as high risk on five of six risk-factor scales performed significantly worse than low-risk students on a variety of student success measures (table 2).
Table 2. Performance of First-Time Students Identified as High Risk by the CSI Survey
| First-Time Students | Low Risk | High Risk | Increase or Decrease |
|---|---|---|---|
| Withdrew | 3% | 11% | 267% |
| Ended term on probation | 14% | 39% | 179% |
| Ended term in good standing | 79% | 40% | −49% |
| Average GPA | 2.74 | 1.60 | −42% |
The Intersection of High-Risk Groups
Using the results of both the predictive model and the CSI risk factors identifies a subpopulation at extremely high risk — a 450 percent increase in probation rate, a 400 percent increase in withdrawal rate, and a 61 percent decrease in attaining good academic standing (tables 3–5).
Table 3. Probation Rate for Students by CSI Risk Categories
|
| CSI Risk Factors | |
|---|---|---|
| Predictive Model | Low Risk | High Risk |
| Low Risk | 8% | 25% |
| High Risk | 30% | 44% |
Table 4. Withdrawal Rate for Students by CSI Risk Categories
|
| CSI Risk Factors | |
|---|---|---|
| Predictive Model | Low Risk | High Risk |
| Low Risk | 3% | 0% |
| High Risk | 3% | 15% |
Table 5. Percentage of Students Achieving Good Academic Standing
|
| CSI Risk Factors | |
|---|---|---|
| Predictive Model | Low Risk | High Risk |
| Low Risk | 87% | 56% |
| High Risk | 55% | 34% |
As a result of these predictions for this very high-risk subgroup, we are:
- Reexamining our admissions procedures
- Investigating earlier outreach or other interventions to have a bigger impact on the success of these students
- Investigating the possibility of a summer bridge or extended first-semester timeline for these students
In this video author Loralyn Taylor presents the results of the targeted analytics in more detail (8:02 minutes):
Gains in Student Success
Targeting our use of analytics to identify, prioritize, and reach out to at-risk students as early as possible has resulted in large gains in student success. In the following tables results are compared between the fall 2011 semester and the three-year average prior to the start of the program (fall 2007–2009).
For final grades, the percentage of F grades is down 43 percent, while the percentage of A grades is up by 11 percent and the percentage of B grades is up by 12 percent. The percentage of students who receive at least one final grade of D or F decreased 28 percent from 46.1 percent to 34.3 percent (figure 1).
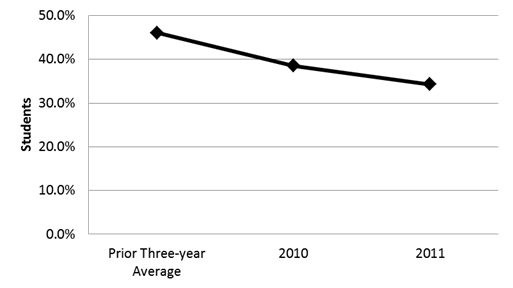
Figure 1. Percentage of students earning at least one D or F final grade
In addition, the percentage of all students with a GPA in good standing (2.00 or greater) increased 11 percent, from 75 percent to 83 percent, for term GPA and 7 percent, from 82 percent to 88 percent, for overall GPA (figure 2).
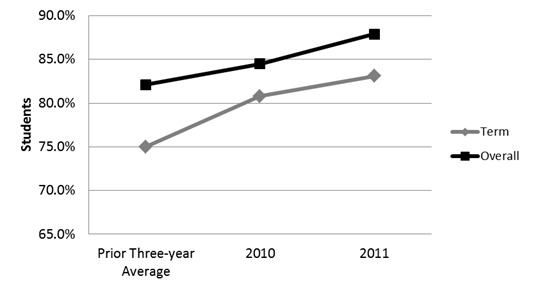
Figure 2. Percentage of students in good standing by GPA
The percentage of students placed on probation has declined by 36 percent, from 11.1 percent to 7.1 percent, while the percentage of students suspended has declined 41 percent, from 3.5 percent to 2.1 percent (figure 3).
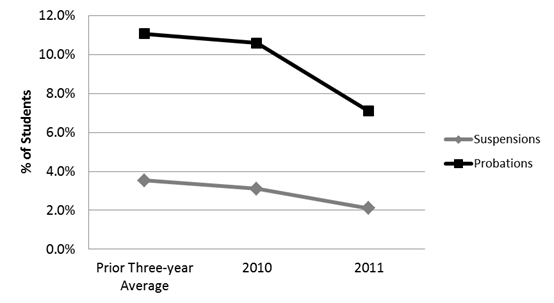
Figure 3. Percentage of students ending semester on probation/suspension
Graduation rates for associate degree–seeking students graduating on time (in two years) has increased 23 percent from the prior three-year average of 17.2 percent to 21.2 percent for the fall 2009 cohort. The Comprehensive Student Support Program started during this cohort’s second-semester freshman year (figure 4).
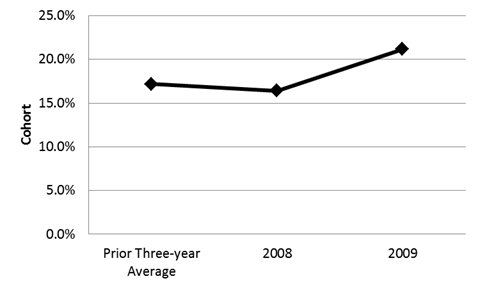
Figure 4. Percentage of associate degree–seeking students graduating on time (in two years)
Results
Our results demonstrate that even smaller colleges with minimal institutional research capabilities can use technology to increase their analytic capability. By targeting the earliest possible identification of at-risk students through predictive modeling and automating identification and prioritization, we can provide critical, actionable data to the right people at the right time, resulting in large gains in both efficiency and effectiveness. These gains in our student success efforts have resulted in increases in the success, persistence, and graduation rates of all of our students.
Our results are replicable by institutions of any size and fiscal means. The Rapid Insight program suite (Veera and Analytics) costs $8,000 for the first year and $3,500 per year after, or $5,000 and $1,750 for only one program. These products have been used by the institutional research office for over three years to automate federal, state, and survey reporting as well as modeling high-risk students, increasing the efficiency and effectiveness of our less-than-one-FTE office. Starfish pricing is based on the number of students tracked in the system, making it financially viable for small schools or larger schools that want to focus only on a particular student cohort (e.g. first-year students). While the college did make a new investment in the Starfish software, our investment was easily recouped after the first semester on the system by increased net student revenue due to increased overall retention. To date, we have returned over $2 million in net student revenue in just two years of our new Comprehensive Student Support Program (table 6).
Table 6. Increase in Net Student Revenue due to Increased Overall Retention Rate
|
| Increased Retention | Additional Students | Net Student Tuition |
|---|---|---|---|
| Spring 2010 to Fall | 4.40% | 36 | $360,000.00 |
| Fall 2010 to Spring | 0.80% | 39 | $390,000.00 |
| Spring 2011 to Fall | 3.60% | 59 | $590,000.00 |
| Fall 2011 to Spring | 2.00% | 70 | $700,000.00 |
|
|
| Grand Total | $2,040,000.00 |
© 2012 Loralyn Taylor and Virginia McAleese. The text of this EDUCAUSE Review Online article (July 2012) is licensed under the Creative Commons Attribution-NonCommercial-ShareAlike 3.0.