
Key Takeaways
- As organizations adopt a decentralized model based on distributed systems with a wide variety of configurations, staffing the operations center with personnel possessing the necessary skills to address all of the specific troubleshooting needs becomes an impractical task.
- An event management system that can handle alerts coming from numerous industry-standard monitoring tools provides a mechanism that helps consolidate, standardize, and centralize the management of distributed environments.
- Temple University deployed an Event Management System to help manage the support requirements of the university's enterprise resource planning environment.
- Following the success of the initial EMS deployment, the university plans to expand the system to handle other enterprise data center events outside of ERP.
The days of the mainframe with a single centralized console are long gone. As organizations adopt distributed systems, operations teams must deal with new challenges. From network monitors to alerts, from various hardware components to job scheduling systems, an operator is faced with too many distinct technologies, making it difficult to oversee them all in an effective manner. Combined with users who demand access to applications 24 × 7, this collection of technology makes staffing an operations center with operators who have the required skill set a difficult challenge or even an unrealistic expectation.
In this article, we discuss an event management system that, in conjunction with monitoring tools capable of issuing Simple Network Management Protocol traps (SNMP traps) or of collecting logs generated by systems, serves as a centralized console for distributed environments. We refer to the actual implementation of such a console as the Event Management System (EMS). To ground our discussion, and because of how Temple University Computer Services' need for such a system originated, we present the EMS in the context of operating a university enterprise resource planning (ERP) environment. However, the EMS was designed to be a general-purpose event management solution that can handle events coming from systems other than ERP.
An ERP system represents a major shift in the application architecture for an organization. Instead of a heterogeneous suite of applications running on a loosely coupled collection of systems, an ERP system encompasses all of the essential business processes that support an organization's operations within a single integrated system. While integration within an ERP is clearly compelling from a business perspective, the risks associated with this approach are also significant. Using an ERP forces an organization to concentrate "all of its eggs in one basket." Any outage of the ERP system will have a significant impact on operations, and an extended outage could be devastating. To mitigate these risks requires taking additional measures to ensure the ERP system's availability. Any event that could cause an unscheduled outage must be identified and brought to the attention of the proper support teams before a minor issue becomes a major issue. The EMS was designed to do just this.
The stakes have never been higher. In the past an outage in, say, the accounts payable system would have had no direct impact on the student registration system. However, an outage in the ERP system represents an outage in all the major systems. From accounts payable to the student registration system, if the ERP is down, all operations of the university stop. Thus, high availability of the system is crucial.
As part of addressing the high availability requirement, a team of operators staffs the data center and monitors systems 24 × 7 × 365. Given the diversity of technology, however, the typical operator faces monumental challenges. The breadth of technologies operators must know how to work with is simply overwhelming. They must develop expertise with:
- Databases, to identify issues like tablespaces running out of space or transaction logs filling up.
- Job schedulers, to watch for critical jobs that have failed.
- System-monitoring consoles, to spot problems with systems and applications or with the network.
- Hardware-specific monitoring technologies (such as server and SAN monitoring tools), to ensure systems have access to their data.
Faced with the challenges of monitoring a wide range of diverse system components with a small crew of operators who had little or no experience with distributed technologies, it soon became apparent that an event management solution would be required for Temple's environment. This event management solution came to light in the form of the EMS, a centralized event monitoring tool that would act as the focal point where all the alerts issued by all the components of the ERP environment would be captured and appropriately processed. In this article we describe the architecture of the EMS, as well as the relevant details of the actual deployment. In the last section, we include links to video clips showing various perspectives of the EMS system as well as a usage demo.
IT Event Management
As a distributed system with hundreds of components, including servers, storage, networking elements, and so on, an ERP presents difficult management challenges. Keeping tight control of the state of all the components, each of which could encompass dozens of subcomponents, very quickly becomes an overwhelming task. To begin tackling this challenge, monitoring tools become a necessity, whether scripts or full-fledged applications. These monitoring tools generate a sprawl of alerts that quickly starts growing exponentially, however.
For the specific case of Temple's ERP environment, the primary monitoring technologies include a combination of proprietary and open-source tools, as shown in Table 1.
Table 1. Monitoring Tools at Temple University
| Monitoring Tool | Monitored Target |
| Oracle Enterprise Manager | Oracle database and application server monitoring |
| Hobbit | Server OS and basic application monitoring |
| Zenoss | Network monitoring |
| EMC SAN | Storage monitoring |
| Dell OpenManage IT Assistant | Hardware monitoring |
| AppWorx | Job scheduling |
Collectively, this set of technologies monitors all of the key systems and applications comprising Temple's ERP system. Each of these technologies records dozens of vital signs for the systems and applications that fall within their monitoring scope. For each of those vital signs, detection of a potentially anomalous condition could generate dozens of alerts. This scenario raises the issue of an exponential growth in alerts.
A second situation requiring attention is the fact that each of these monitoring technologies issues alert events in their own nonstandard format. Parsing through lengthy, cryptic alert messages complicates enormously the process of determining the characteristics of the issue being reported.
A third aspect to keep in mind is that once the alerts have been generated, collected, and parsed, it is necessary to determine the significance of each alert message within the context of the target — namely, the ERP — environment. Classifying alerts into categories based on their criticality to the health of the target environment increases the complexity of the monitoring tasks. Any mishandled categorization could result in target systems going down if vital signs were not properly addressed or in an unnecessary escalation of the issue to support personnel if the vital signs were misread.
Not Just Another Monitoring Tool
The architecture behind the solution devised for Temple follows a centralized approach. An event manager at its core receives event data from multiple distributed sources. As long as the predefined protocol for the exchange of event data is met, the source of the event does not matter to the event manager. These sources can be either monitoring tools or any application that generates events.
Temple's event manager, the EMS, was implemented using the Computer Associates Network and System Monitor (NSM). The EMS is configured to function as a central event manager, also known as a "manager of managers" (MOM).
Event messages from the various distributed components are processed based on a predefined policy. In the case of Temple's configuration, all alerts are categorized as one of three different types of alerts:
- Informational Alerts: Informational alerts are simply logged; the operator takes no action. Informational messages from all components are integrated into the centralized EMS log and can be used as a diagnostic tool when problems occur.
- Warning Alerts: Warning alerts represent items that require attention from a functional or technical support team member but not until the next business day. For example, when utilization of the Oracle transaction logs reaches 60 percent, Oracle Enterprise Manager generates a warning message. When the EMS receives warning messages, they are logged like informational messages. In addition, a trouble ticket is created — the Temple configuration uses BMC Software's Remedy — for the appropriate functional or technical support team. A representative from each support team monitors the trouble ticket queue during normal business hours, and warning messages are brought to their attention. Reports from the trouble ticket system can provide information on the number of alerts received and the speed with which these alerts are addressed.
- Critical Alerts: Critical alerts represent items that require immediate attention by the operator and/or the support team member who is on call. Critical events are also known as "actionable" events. For example, when utilization of the Oracle transaction logs reach 90 percent, Oracle Enterprise Manager generates a critical message. Like informational and warning messages, critical messages are logged. Like warning messages, a trouble ticket is created for the appropriate functional or technical support team. Reports from the trouble ticketing system can provide information on the number of alerts received and the speed with which these alerts are addressed. In addition, for critical alerts, messages are reformatted to conform to a standard format and posted to the "held area" of the EMS. While informational and warning alerts scroll off the EMS with no need for the operator to watch them, critical alerts posted to the held area are fixed until cleared by the operator. Associated with critical alerts are a set of predefined standard operating procedures (SOPs). The operator follows these SOPs to respond to critical alerts before clearing them from the held area of the console.
Figure 1 presents the console and the location of the different message types.
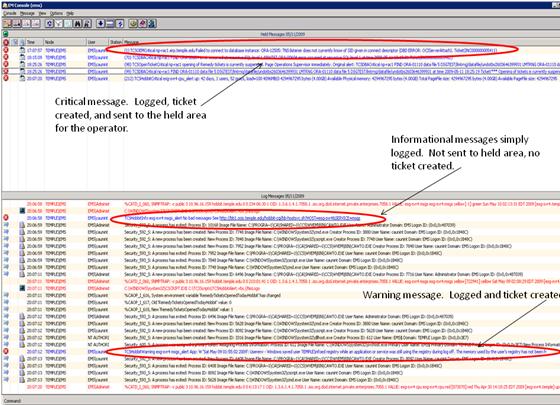
Figure 1. Console Showing Message Types and Treatment
Sources of Events
The EMS accepts alerts from any kind of monitoring tool or application as long as a predefined protocol is followed. In the case of the Temple configuration, the components shown in Table 2 forward alerts to EMS. The table also lists the technique used to deliver the alert to the EMS.
Table 2. Source and Type of Alerts with Delivery Technique
| Source of Alert | Description | Delivery Technique |
| AppWorx | Reports on jobs that end with a status of "ABORTED" | Syslog daemon |
| DBA scripts | Various alerts generated by scripts developed by the DBAs | SNMP traps |
| SAN | Alerts for SAN-related events | SNMP traps |
| Hobbit | Alerts for server (OS and high-level application) related events | SNMP traps |
| Hardware | Server hardware–related events | SNMP traps |
| Oracle Enterprise Manager | Oracle database and Oracle application server–related events | SNMP traps |
| Zenoss | Network-related events | SNMP traps |
Delivery Technique
Alerts are delivered to the EMS using one of two different protocols, namely:
- Syslog daemon
- SNMP traps
Syslog Daemon. The first kind of protocol is based on a low-level collection and transfer of syslogs. In this case, the EMS functions as a centralized syslog daemon. In the case of Temple's configuration, all ERP Linux boxes have their syslogs forwarded to the EMS. Each message received by the syslog daemon is routed through the EMS for analysis. If the message matches a "message record," the EMS processes the message by invoking a predefined script.
In the case of Windows boxes, an intermediate step is needed. An open-source utility known as SNARE acts as an agent that forwards all messages written to the local NT event log (application, security, and system) to a centralized syslog server, here the EMS, running its syslog daemon. Each message received by the syslog daemon is routed through the EMS for analysis. If the message matches a "message record," the EMS processes the message by invoking a predefined script.
SNMP Traps. The second kind of protocol is based on SNMP traps. Any system that can generate SNMP traps can send these traps to the EMS. Each message received by the SNMP trap daemon is routed through the EMS for analysis. If the message matches a "message record," the EMS processes the message by invoking a predefined script.
Critical Events and SOPs
Operators typically have some sort of "run book" that contains the SOPs executed in response to events. At Temple University, the EMS serves as a link between events and the SOPs to be followed to address those events.
An exit route was created to provide the linkage between a specific event and the associated SOP. When an operator points and clicks at a message from the console held area, a script is invoked. Based on a predefined standard format, this script parses the selected message into its key components. Once the message has been parsed, a database that associates events with SOPs is queried to find the link to the corresponding SOP, which is stored as a web page on a web server. The SOP is then displayed on a web browser. The operator follows and executes the given SOP. As a final step the operator marks as closed the corresponding entry in the held area of the Event Manager console documenting what was done to address the issue.
Support Teams
Whereas the EMS facilitates the management of events generated by various monitoring utilities and applications, the support teams support the escalation process. Various support teams classified as either functional or technical teams provide 24 × 7 operational support. Functional support teams include subject matter experts who specialize in the applications comprising the target system, in our case Temple's ERP system. The Banner Finance team is an example of a functional support team. Technical support teams include subject matter experts who specialize in the technologies that support the ERP applications, for example, the Server Support or DBA teams.
Ideally, escalation of issues occurs in a tiered manner. When critical events occur, they are initially handled by the operator implementing the associated SOP. If the issue is not resolved by the execution of the SOP, escalation to the support team takes place. The member of the support team currently on call is then contacted.
System Monitoring Versus User Help Desk
It is important to realize that EMS and the operator group around-the-clock escalation of critical events are not a substitute for a help desk. In fact, these functions actually complement each other.
The role of the EMS is to capture and organize incoming alerts automatically generated by systems in the field. The EMS provides the interface between the hardware and software systems in the environment and the operators. Operators (the first tier of support) ultimately will execute a previously defined SOP, which could lead to the escalation of the issue to other tiers of support. At no point do the EMS and the operators interact with the end-user community.
On the other hand, the help desk interfaces with the user community's alerts/complaints and executes their own set of SOPs to address those issues. Their procedures can lead to escalation of a problem to other support tiers.
Obviously, one could contemplate combining these two functions in some cases. At Temple, however, we have found that the roles are better performed by separate groups. Some of the reasons for this choice include:
- The help desk serves a very large population and has little bandwidth to delve into system issues. Similarly, the operator group is responsible for hundreds of systems and has little bandwidth to address customer calls.
- The operator group is usually located right next to the data center, which tends to be in a secluded area, away from the general public. The help desk, on the other hand, is located in a highly visible area frequented by a myriad of users.
- The operator group handles duties other than alert management, such as system installation, system decommissioning, and so forth. The help desk also handles other duties in addition to user interaction, including new user account creation, user training, etc.
On-Call Calendars
To manage the scheduling of on-call support, an Exchange-based shared calendar was created. Some of the advantages of using this shared calendar approach include:
- All support team members are familiar with using the Outlook client with Microsoft Exchange.
- The group calendars are used to document who is currently on call for each support team as well as the contact information for the supervisor and manager of each team. Team members, team supervisors, and team managers have authority to update their respective team calendars.
- Operators and help desk consultants have the authority to view all group calendars.
- The on-call calendar is useful not only to the operator staff but can be shared with other groups such as the help desk.
Thus, when a critical event occurs and is reported to the EMS console, or when a user places a call to the help desk, the operator or help desk consultant uses the information in the calendar to escalate issues to the support team member currently on call.
Regarding management of the calendar, the operations team populates the calendar with contact information for the supervisor of each team. Contact information of the support team members is added and maintained by the specific individuals. In this way, the same individuals who will respond to the escalation requests keep the calendar up-to-date.
Group calendars are reviewed weekly to ensure that contact information is provided for a primary and backup on-call support person at all times. When a gap in coverage is identified, the supervisor of the support team is notified. In the absence of an on-call resource, issues are escalated to the supervisor of the support team.
Other Event Management Tools Considered
A wide variety of other tools provide event management capabilities and compete directly with Computer Associates' NSM. Temple University evaluated a number of these tools as part of making the decision to implement NSM. The other tools considered follow.
OMNIbus from IBM
OMNIbus is part of the Tivoli product line from IBM and was purchased from a company called Micromuse. While the product originally sold by Micromuse was popular and considered fairly lean and agile by the organizations that implemented the tool, the costs and complexity associated with implementation increased substantially after IBM integrated the tool into the Tivoli product line. Due to the unconventional way in which NSM was deployed at Temple University, that is, with a single NSM license to support the event management of an unlimited number of source systems, the pricing was substantially less than the least expensive OMNIbus system. Given the higher cost and level of complexity, the OMNIbus option was eliminated from consideration.
EventManager from Monolith Software
Monolith Software was founded by a number of former Micromuse employees. Monolith actively markets EventManager to OMNIbus users as similar to OMNIbus but leaner and more agile. EventManager does not have the costs and complexity resulting from the integration of OMNIbus into the Tivioli line, but Monolith is still a relatively new and unproven company. In addition, the costs associated with implementing EventManager exceeded those for Temple's NSM solution. Given the higher cost and possible issues with the long-term viability of the vendor, EventManager was eliminated from consideration.
Challenges
A number of challenges influenced the implementation of EMS at Temple:
Centralized Event Management: At Temple University, each system administrator likes his or her monitoring tool and wants to continue managing his or her own alerts. System administrators are not used to the centralized model, having used monitoring tools like Hobbit and Zenoss without a centralized event manager for years. Many system administrators do not see the value of the centralized event management model or the role the operators play. This is often the case in distributed environments with multiple heterogeneous systems, where one might find one or more monitoring tools already in place sending alerts to the various system administrators. The problem with these solutions is that usually the alert transactions are set up as system-to-administrator. In many cases, there is limited record-keeping of alerts. Also, the escalation process would only occur through the help desk when a user complains about a system outage. That is, there is little opportunity for tiered support.
The centralized EMS forces accountability. Systems administrators must fine-tune their monitoring systems and cannot simply ignore alerts that should have been suppressed in the first place. In the past, e-mail was the predominant method of notifying administrators. E-mail reporting an alert would be sent to an entire team of system administrators. With no clear owner, if the administrator currently on call was not in a position to respond, the alert could simply fall through the cracks. Using trouble tickets instead of e-mail, the centralized EMS forces system administrators to be more accountable for alerts. To avoid having too many trouble tickets, administrators quickly silence the alarms not needed and respond quickly to the necessary alarms. The trouble ticketing system provides the ability to report on number of open tickets, length of time tickets have been open, and so forth, again forcing accountability.
Agnostic Monitoring Tools: A centralized event management tool like the EMS is agnostic of monitoring tool specifics. Also, if a system administrator decides to disconnect the monitoring tool, the centralized event management tool will not know about it, and those monitoring the event console might incorrectly assume things are fine. One way to deal with this situation is by having systems proactively report their status via a "heartbeat" signal that lets the centralized event management tool know the state of each monitored entity, including the monitoring tool itself.
Loss of Control: System administrators complain about loss of control of the alert system with centralized event management. The operations group now has responsibility to escalate issues. System administrators may have wired the existing monitoring tools not to page them under specific circumstances. Now they will have to document these cases in an SOP that the operations team can follow or escalation will occur.
Timing: Another potential issue has to do with timing. System administrators might be used to alerts coming directly from the monitoring tool or system. Escalation via the operations group might take additional time. On the other hand, the escalation process guarantees full documentation of incidents, and the issue goes to person rather than risking accidentally being ignored or even missed.
Opportunities
Along with the challenges of centralized event management come new opportunities.
Documentation of Issues: All alerts are stored in a central database. Alerts include not only critical alerts but also routine alerts. All these alerts can later be examined and analyzed to detect patterns and potentially bigger issues.
Metrics Collection: Keeping track of all alerts and escalation events allows for a continuous improvement process as well as definition and control of service level agreements.
Generic Nature of the EMS: Temple used its new ERP environment as the initial target. The plan going forward is to expand use of the EMS tool to all other systems that can generate a syslog, Windows event log entry, or SNMP traps.
Trouble Tickets: Trouble tickets are used instead of e-mail to notify system administrators of warning events as well as to track the responses to critical events. This approach changes the behavior of system administrators. Reports generated by the trouble ticketing system highlight problematic areas, helping identify areas that seem to have chronic issues and areas that are not receiving attention in a timely manner. System administrators want to stay off the radar screens of the supervisors and managers who oversee their areas and so have become more proactive when it comes to identifying and addressing the root causes of problems, eliminating issues instead of simply responding to the symptoms.
Next Steps
At Temple, the EMS effectively handles events related to the new ERP environment. The next step is to expand this concept and let the EMS handle all data center events including system alerts, networking alerts, environment alerts, and any other kind of meaningful alert that requires tracking or even escalating when appropriate.
The following two initiatives have already begun.
- Non-ERP Network Monitoring: Temple has a fairly large and complex network. In addition to the traditional academic and administrative networks one would expect to find at a university, Temple's networks also support the Temple Hospital System, making issues like security and availability paramount. At this time Zenoss is used only to monitor the core networking components of the ERP system. We plan to expand the use of Zenoss and the EMS to monitor Temple's entire network, including other administrative networks, academic networks, hospital networks, networks in dorms, and so forth.
- Non-ERP System and Application Monitoring: While the university currently uses Hobbit for system and application monitoring of ERP and non-ERP systems, only alerts for ERP systems are currently sent to the EMS. We are working to retire Hobbit and move to Zenoss for all system and application monitoring. As part of the migration from Hobbit to Zenoss, we will also begin to route Zenoss system and application alerts from all servers, both ERP and non-ERP.
Going beyond system and application monitoring, we have also started to explore using the EMS as part of facilities monitoring. Temple University supports two major data centers. Both data centers have a variety of technologies in place to monitor facilities, such as things like data center temperature and humidity or alerts from water sensors if spills occur. The key-card system that controls access to sensitive areas in the data center can send alerts that the EMS can also handle. That is where the power of EMS lies: namely, the system's capability to handle alerts coming from myriad sources in an effective and consistent manner.
© 2009 Frank E. Azuola and Martin J. Doyle. The text of this article is licensed under the Creative Commons Attribution-Noncommercial-No Derivative Works 3.0 license.